Download Free World Industry and Economy Maps
Sponsors
<-- Free Map Downloads
<-- World Country Map Downloads
<-- World Thematic Map Downloads
Note that maps may not appear on the webpage in their full size and resolution. To save the maps to your computer, right-click on the link.
Afghanistan - Economic Activity from Map No. 504958 1971 (203K)
Afghanistan - Known Resources from "Report on Progress Toward Security and Stability in Afghanistan", U.S. Dept. of Defense, June 2008 (254K)
Albania - Economic Activity from the CIA Atlas of Eastern Europe 1990 (63K)
Algeria - Economic Activity from Map No. 78692 1971 (154K)
Angola - Economic Activity from Map No. 77961 1973 (100K)
Austria - Basic Resources and Processing from Map No. 77706 1969 (109K)
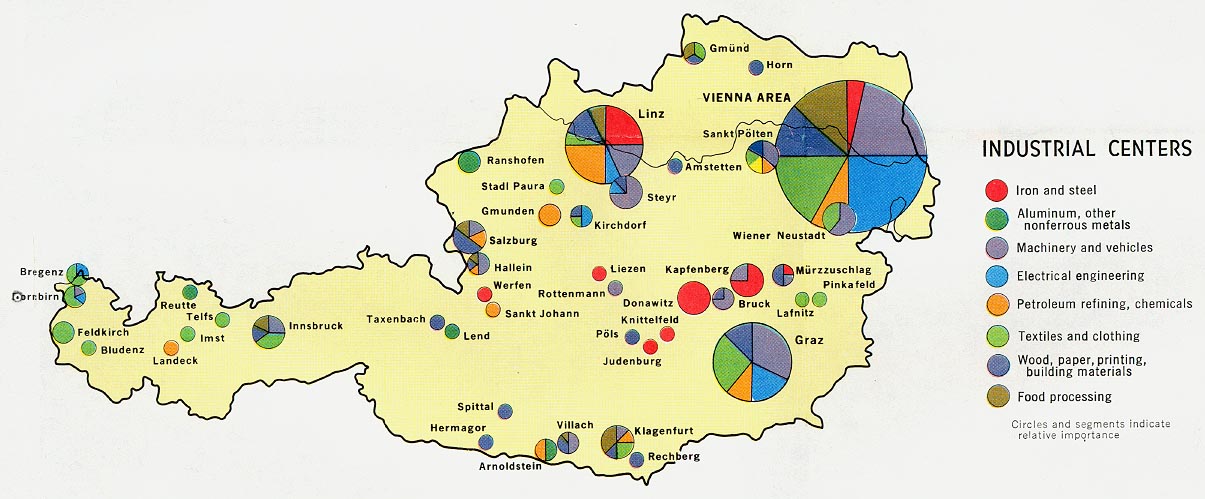
Austria - Industrial Centers from Map No. 77706 1969 (135K)
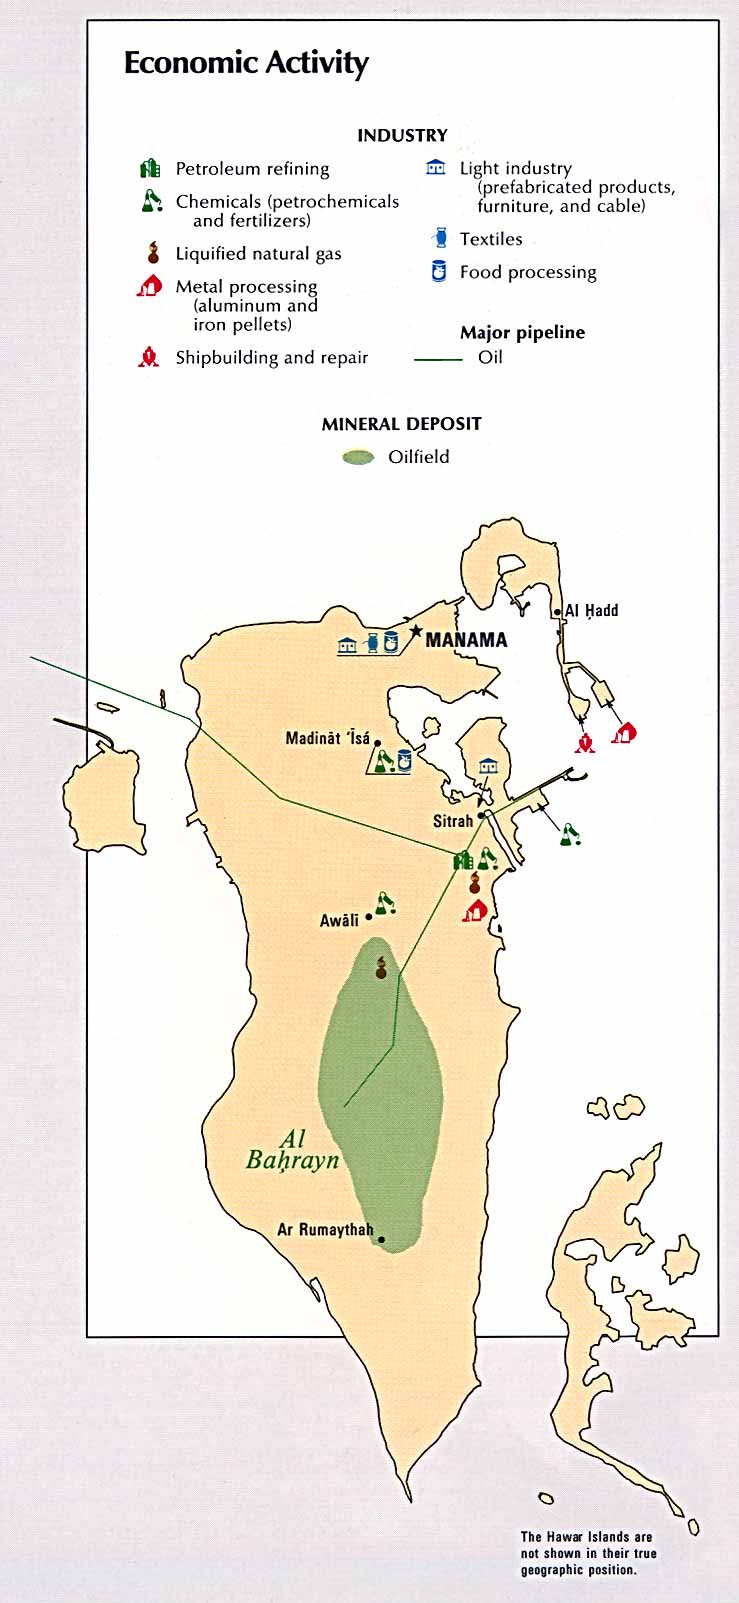
Bahrain - Economic Activity from the CIA Atlas of the Middle East 1993 (104K)
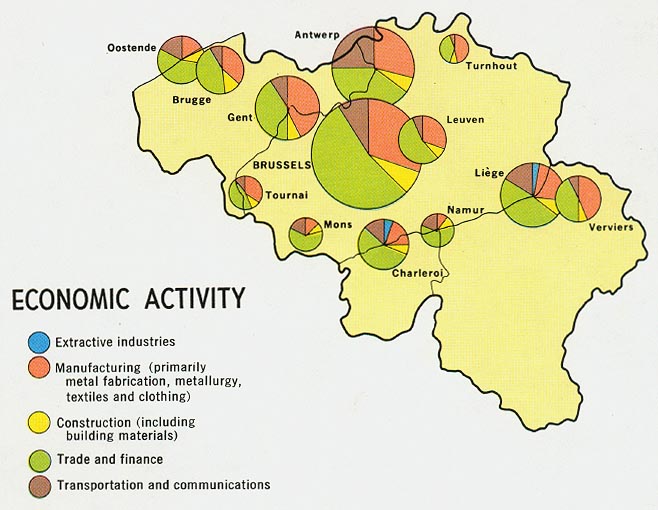
Belgium - Economic Activity from Map No. 75519 1968 (87K)
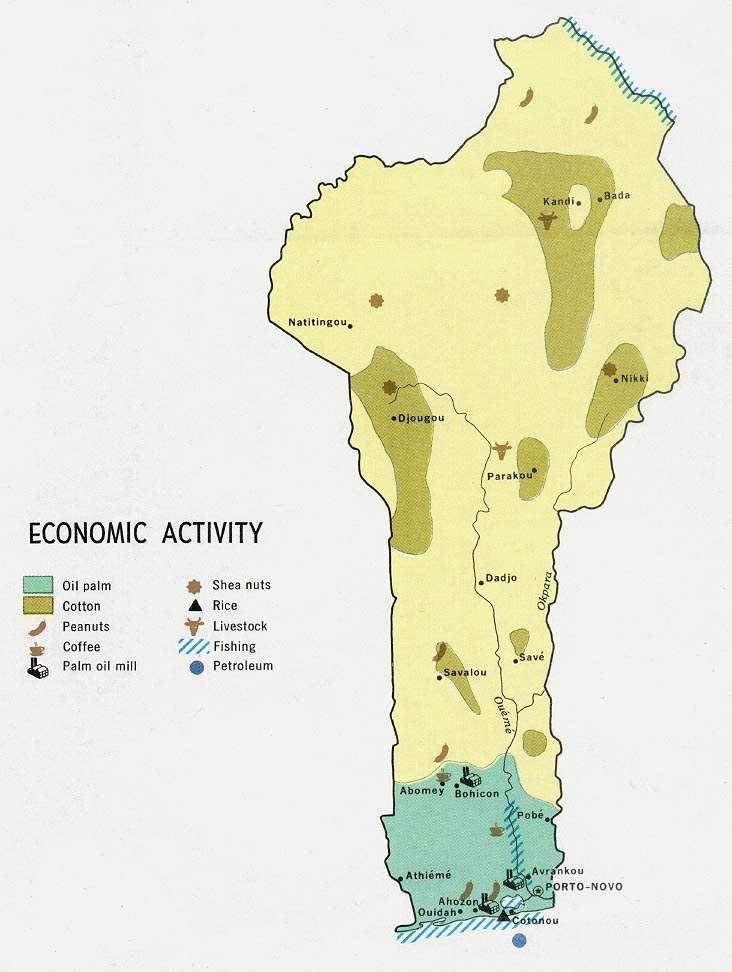
Benin - Economic Acticity from Map No. 77258 1970 (95K)
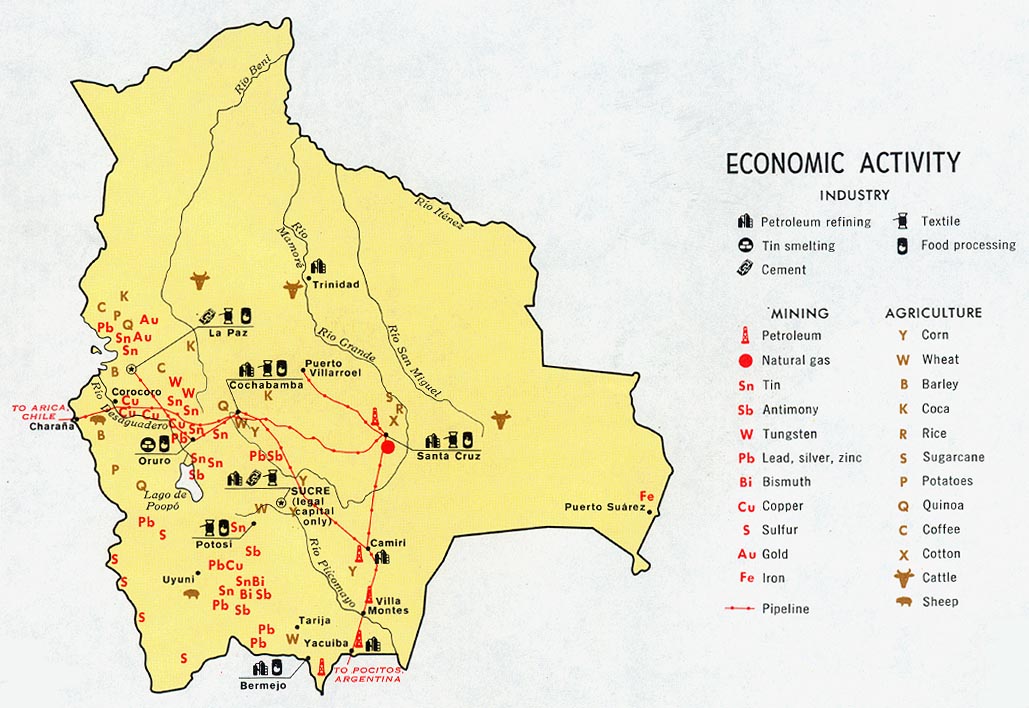
Bolivia - Economic Activity from Map No. 78499 1971 (147K)
Bosnia and Herzegovina - Economic Activity and Natural Resources from Map No. 802172 1993 (115K)
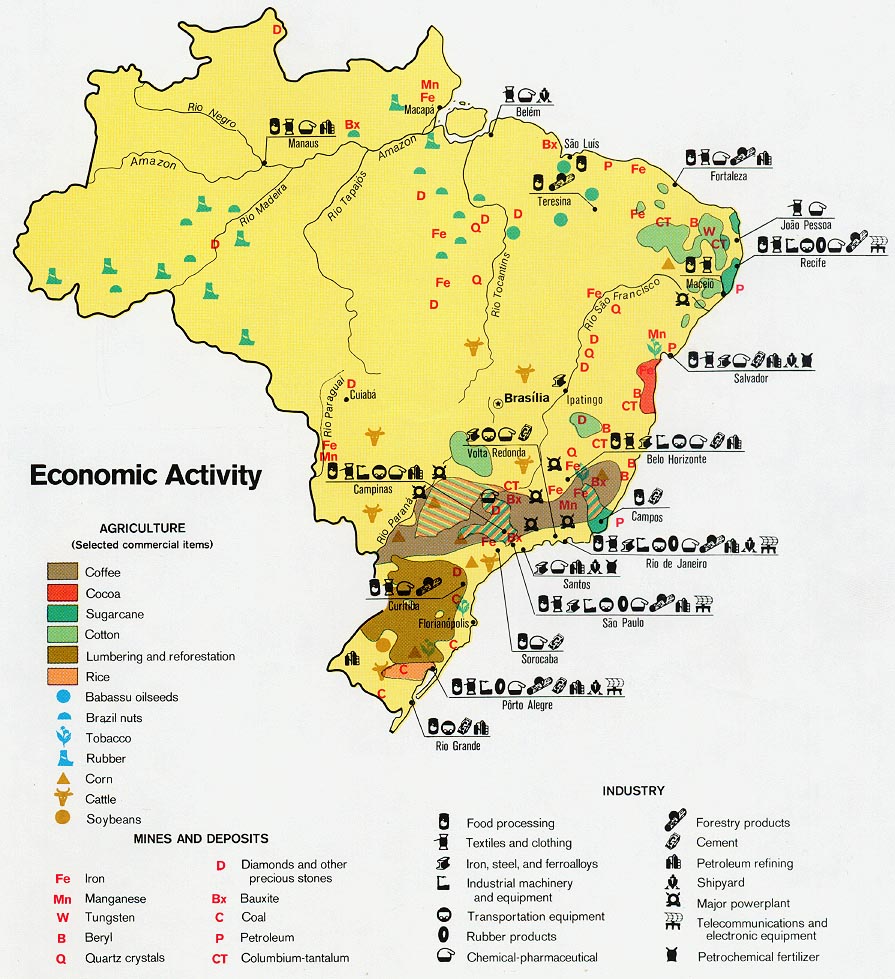
Brazil - Economic Activity from Map No. 503241 1977 (210K)
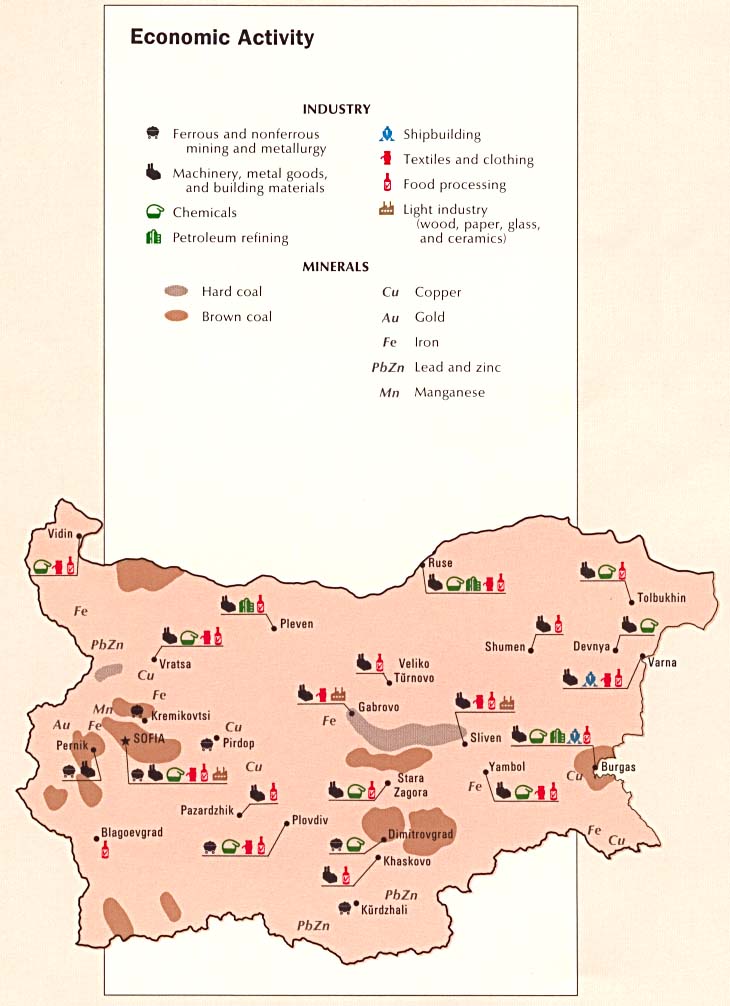
Bulgaria - Economic Activity from the CIA Atlas of Eastern Europe 1990 (85K)
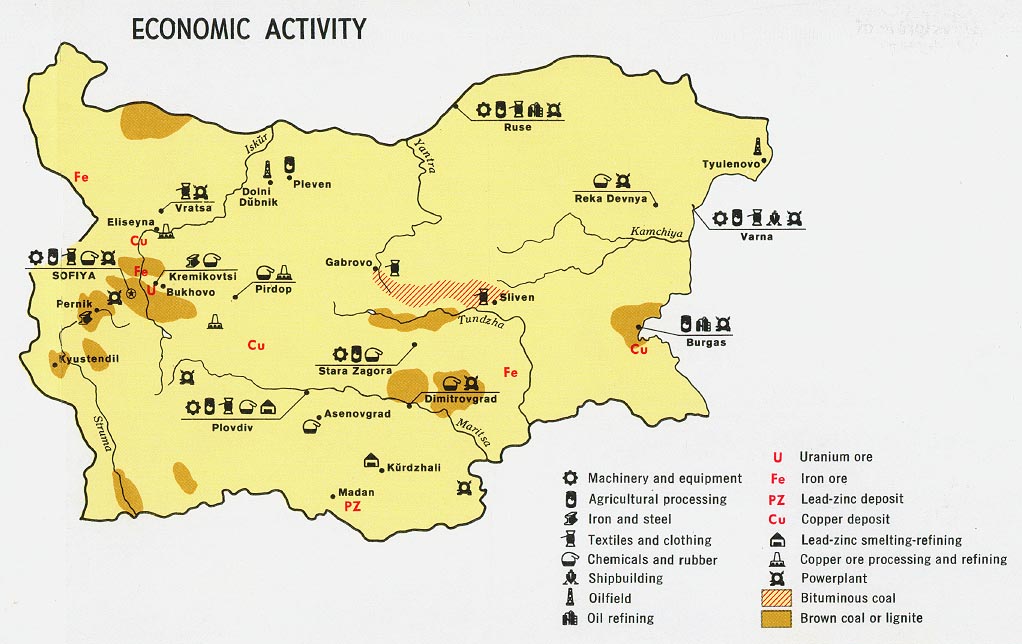
Bulgaria - Economic Activity from Map No. 500252 1972 (131K)
[Burkina Faso] Upper Volta - Economic Activity from Map No. 58207 1968 (94K)
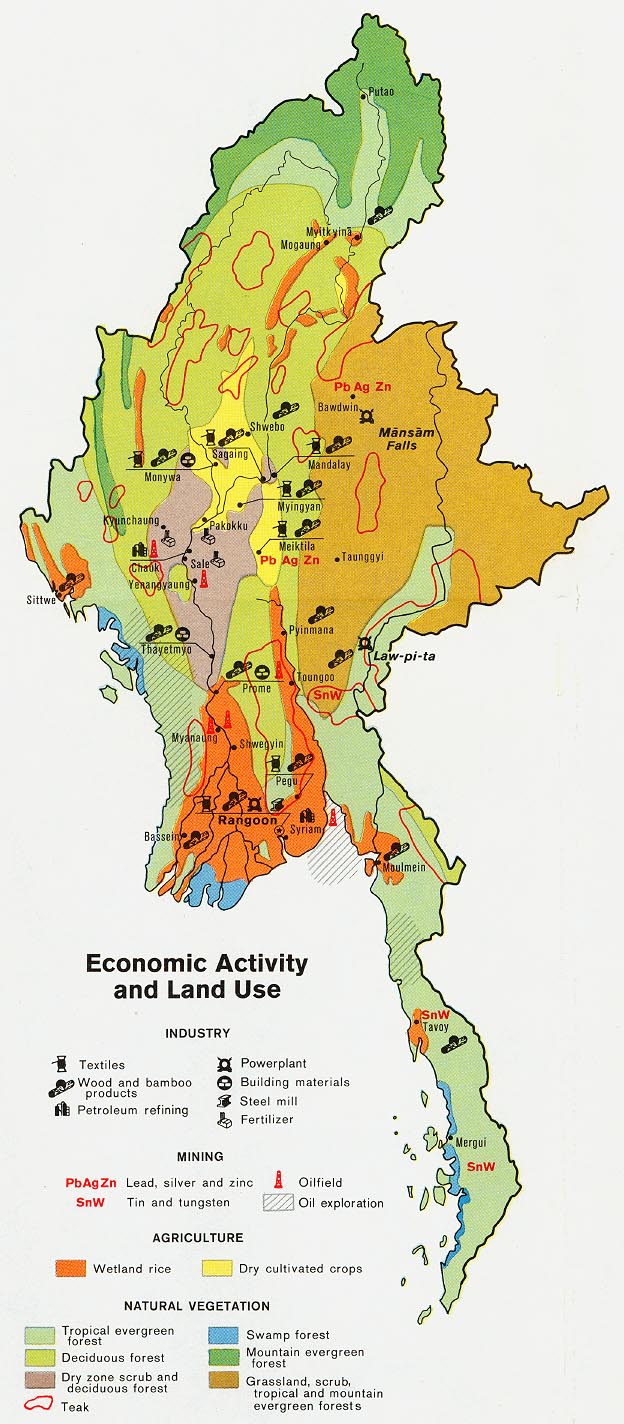
Burma - Economic Activity and Land Use from Map No. 500425 1972 (192K)
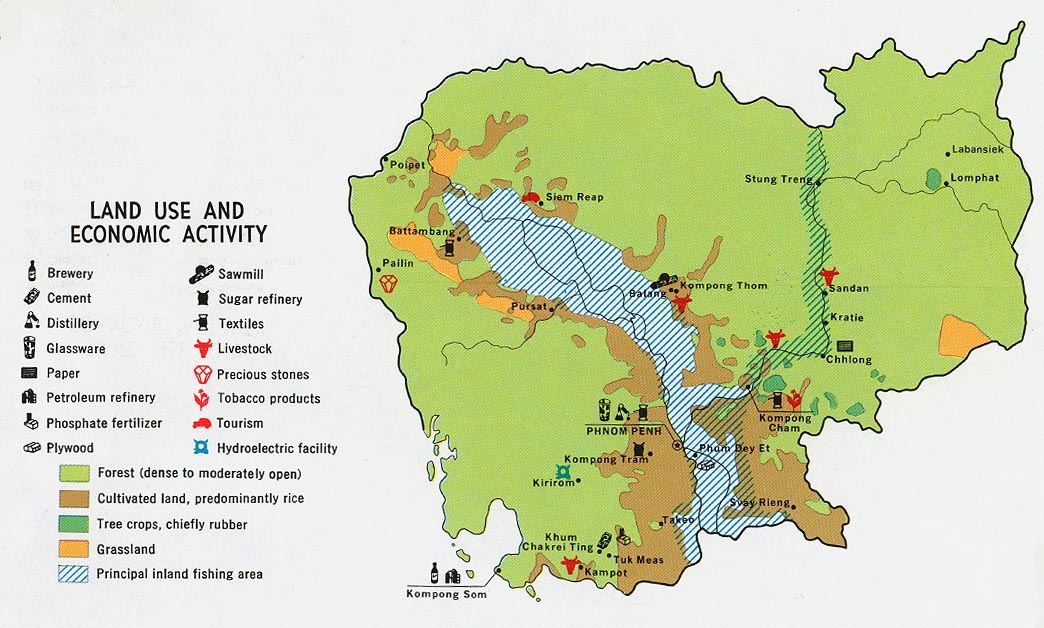
Cambodia - Economic Activity and Land Use from Map No. 77967 1972 (192K)
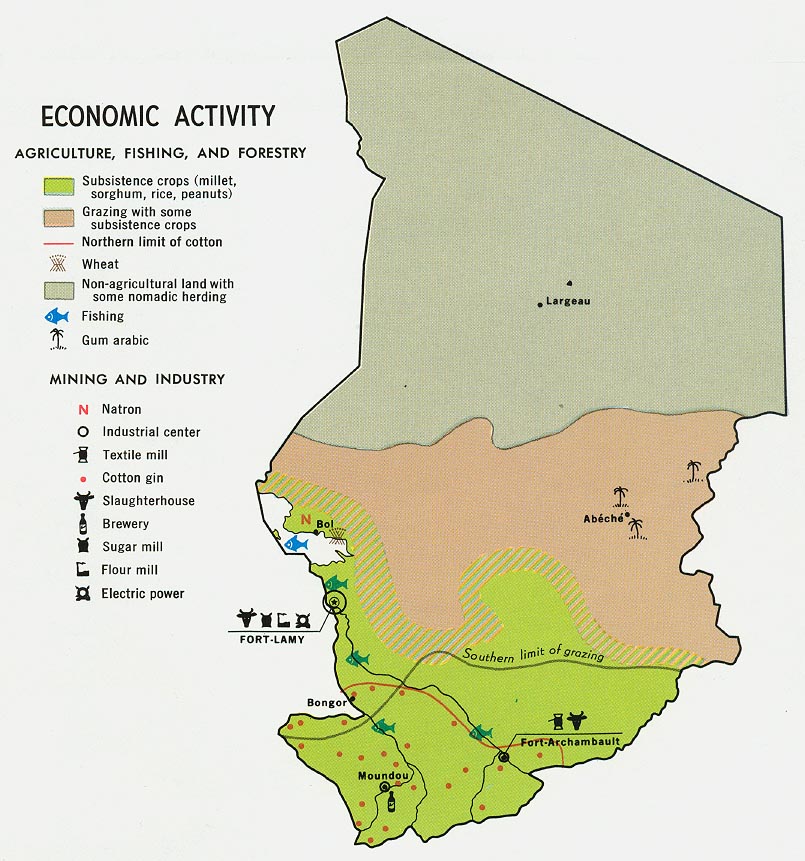
Chad - Economic Activity from Map No. 59886 1969 (158K)
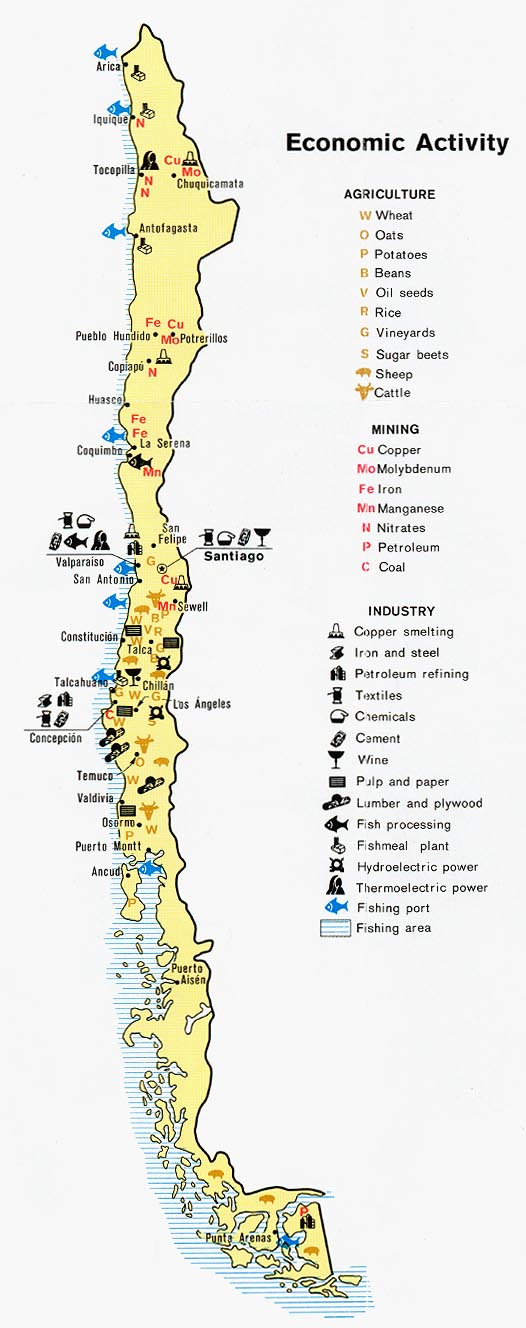
Chile - Economic Activity from Map No. 500814 1972 (114K)
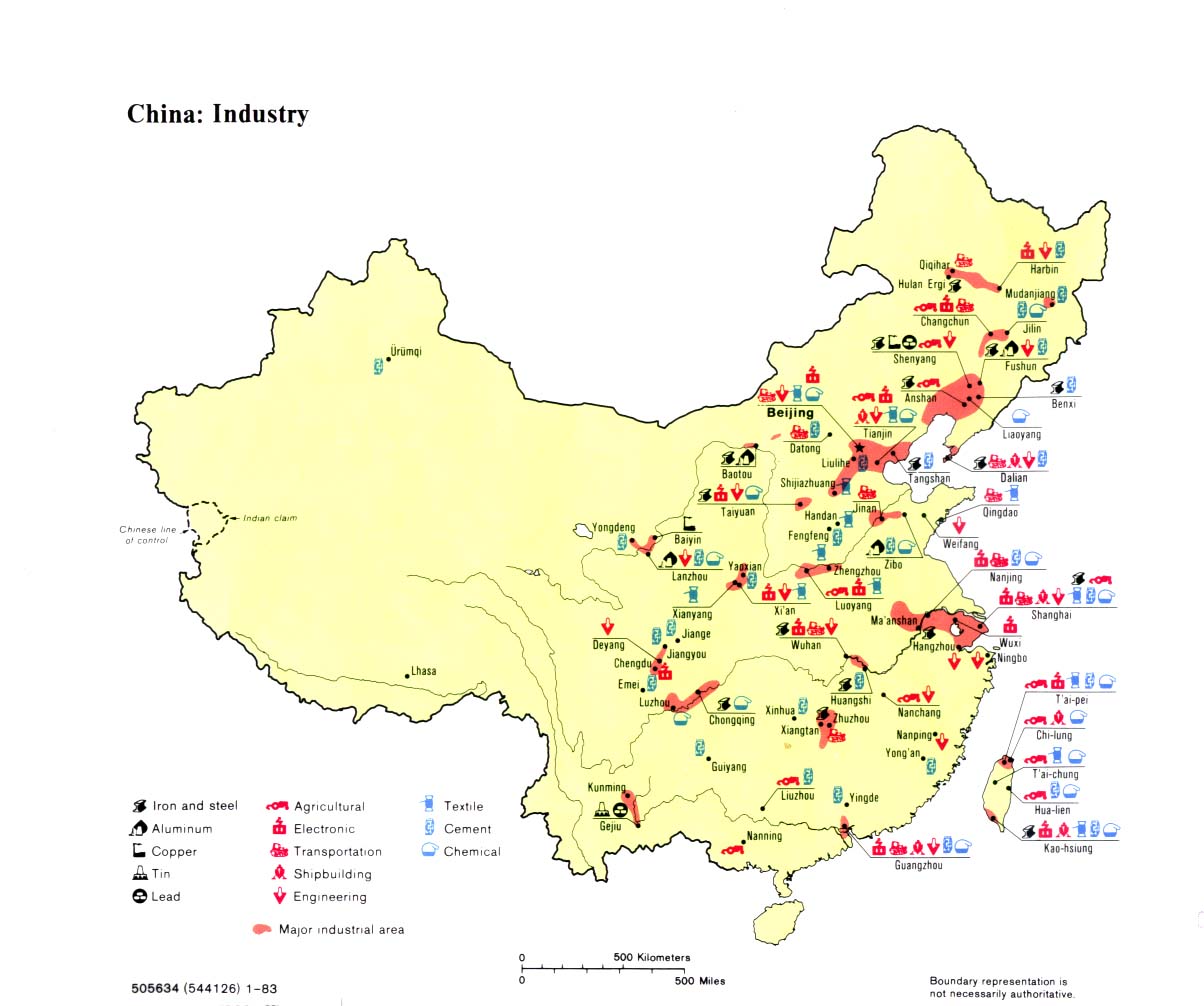
China - Industry 1983 (258K)
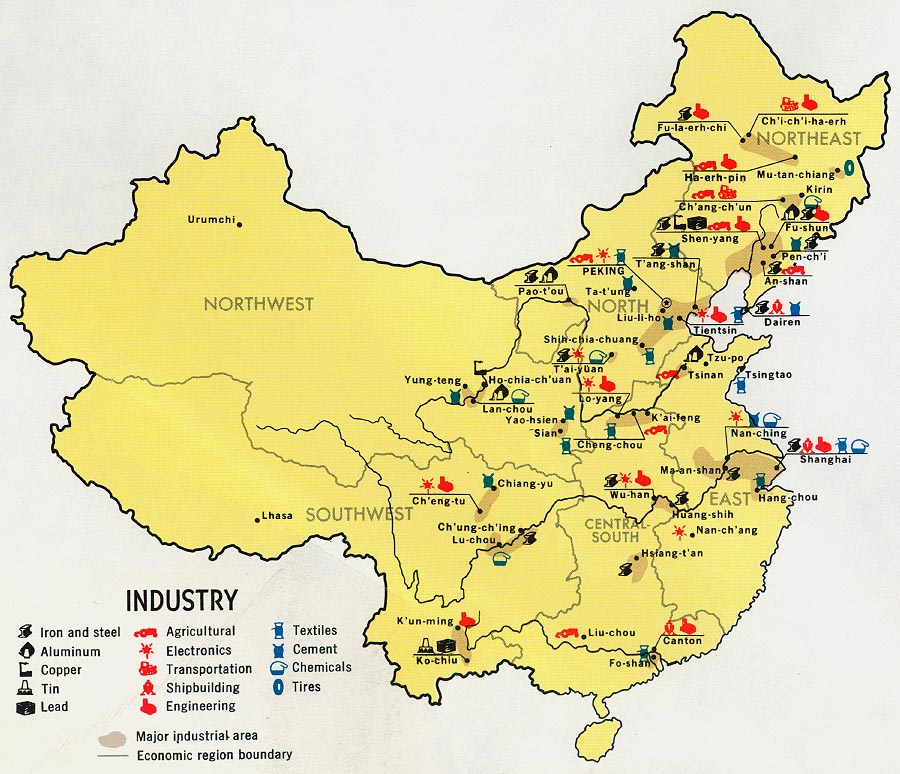
China - Industry from Map No. 500410 1971 (182K)
Colombia - Economic Activity 1970 (148K)
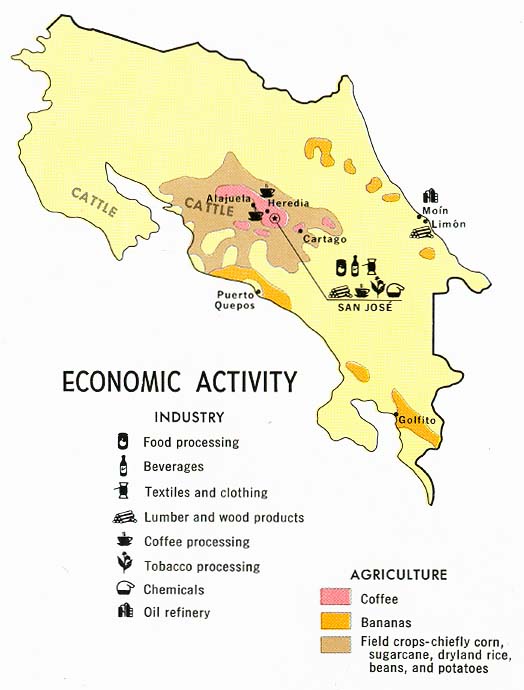
Costa Rica - Economic Activity from Map No. 73665 1970 (148K)
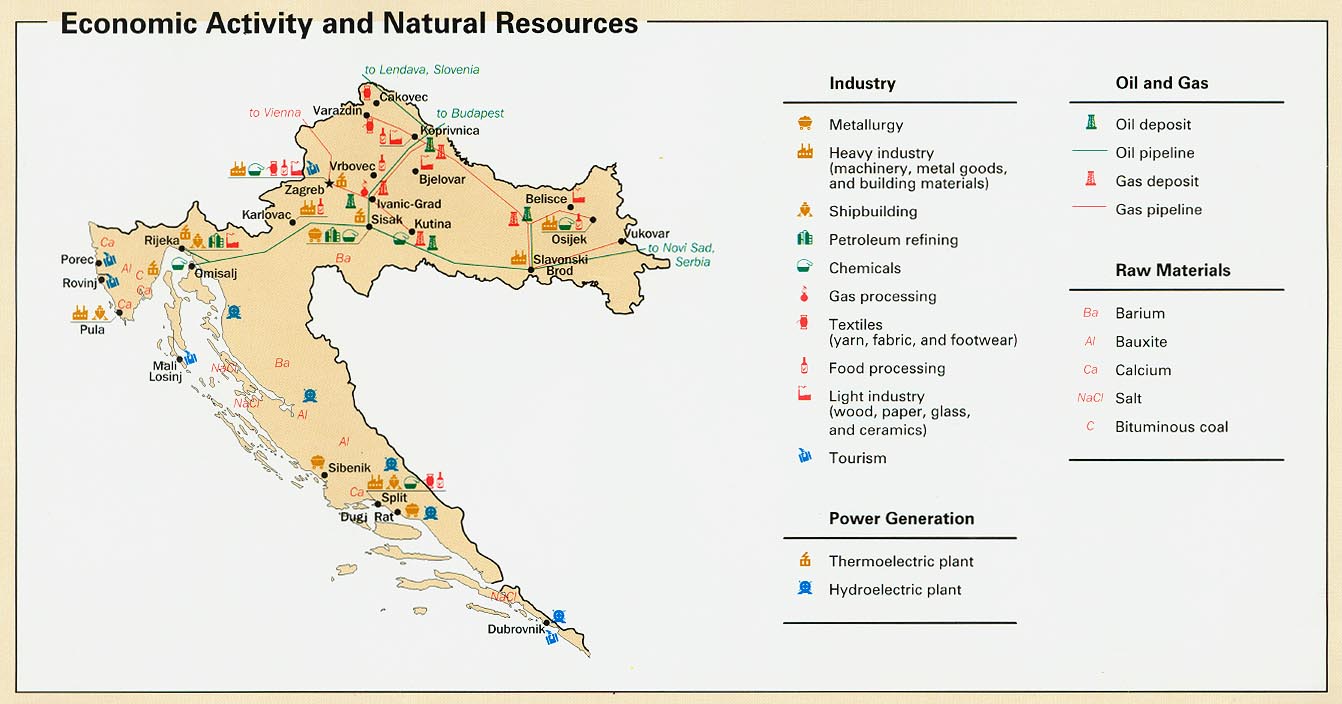
Croatia - Economic Activity from Map No. 802345 1996 (134K)
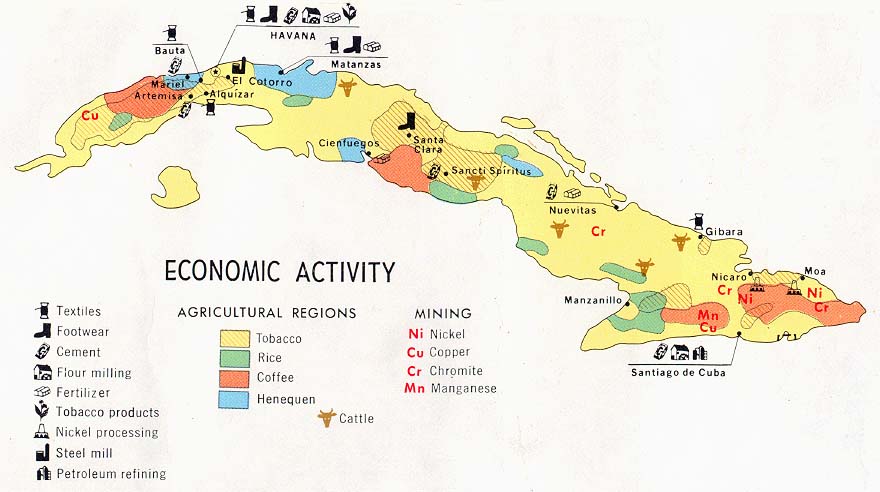
Cuba - Economic Activity from Map No. 502988 1977 (84K)
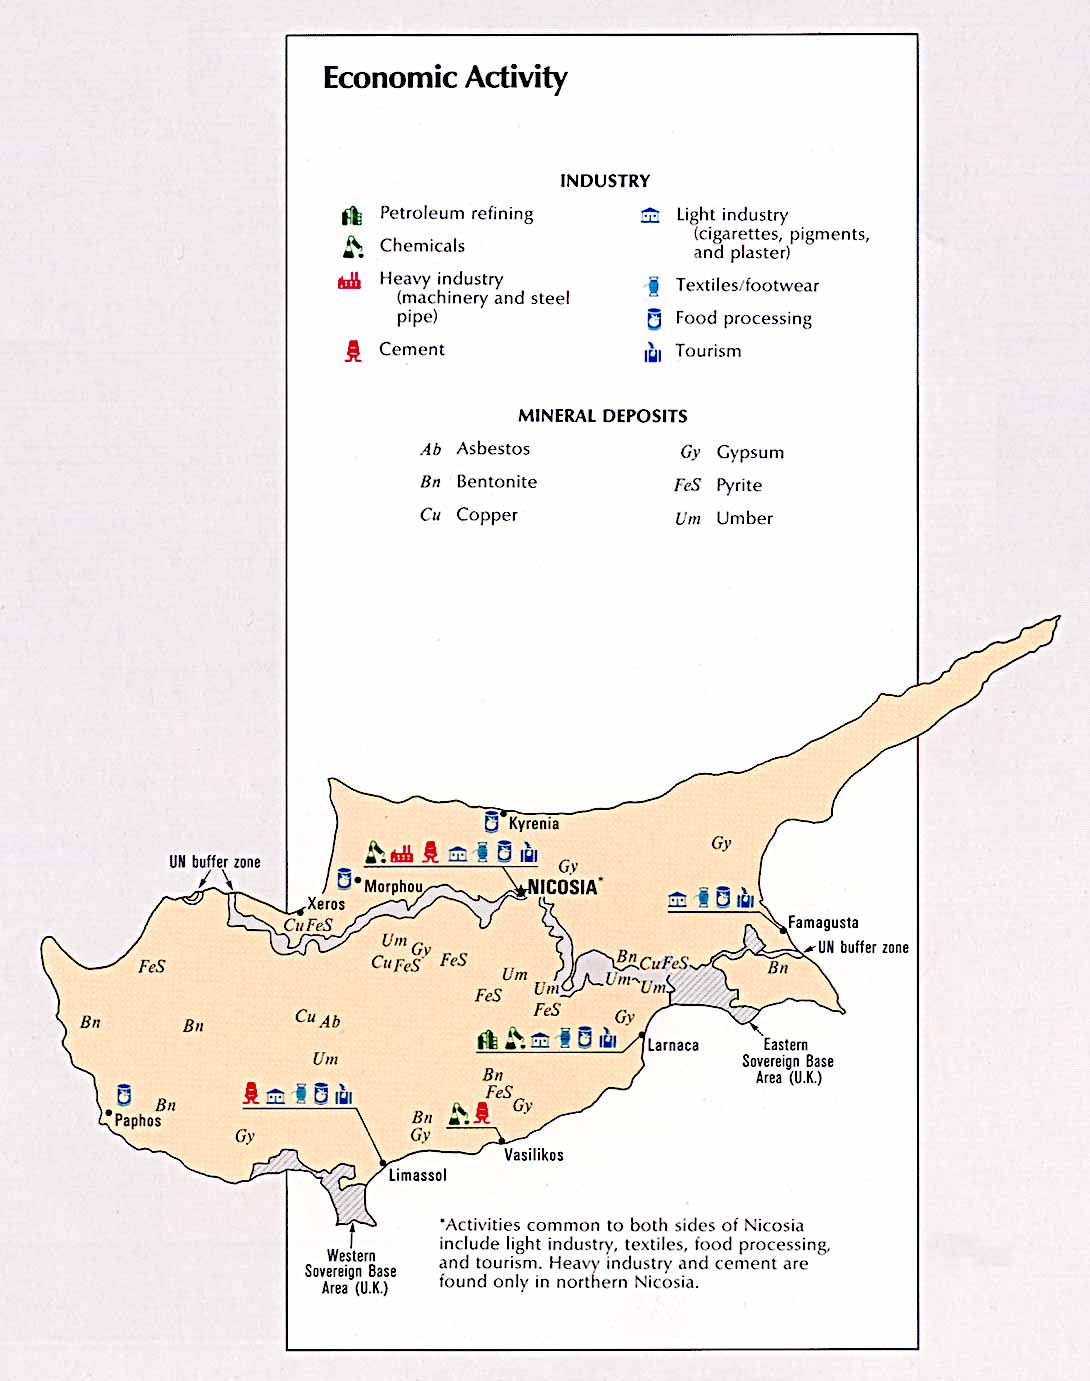
Cyprus - Economic Activity from the CIA Atlas of the Middle East 1993 (121K)
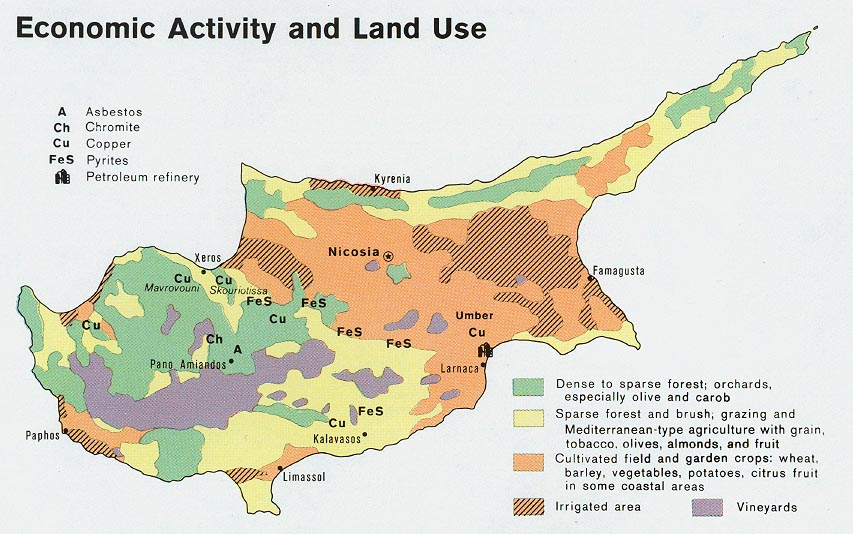
Cyprus - Economic Activity and Land Use from Map No. 500862 1972 (129K)
[Czech and Slovak Republics] Czechoslovakia - Economic Activity from the CIA Atlas of Eastern Europe 1990 (120K)
[Czech and Slovak Republics] Czechoslovakia - Industries from Map No. 501820 1974 (140K)
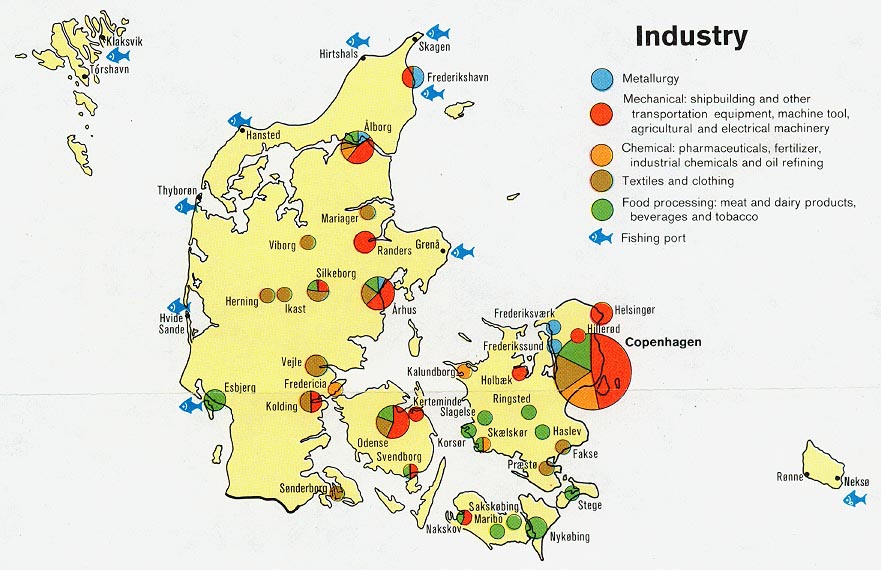
Denmark - Industry from Map No. 501760 1974 (128K)
Sponsors
Dominican Republic - Economic Activity from Map No. 78962 1971 (107K)
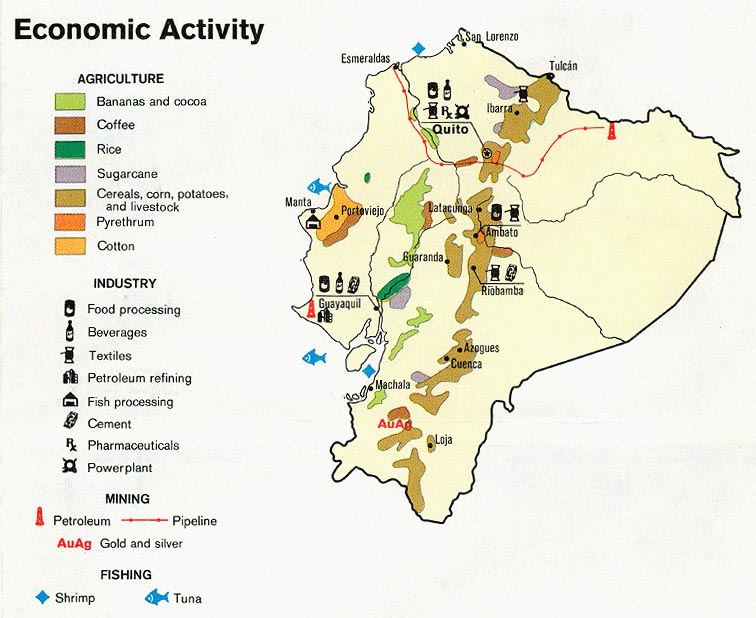
Ecuador - Economic Activity from Map No. 501177 1973 (109K)
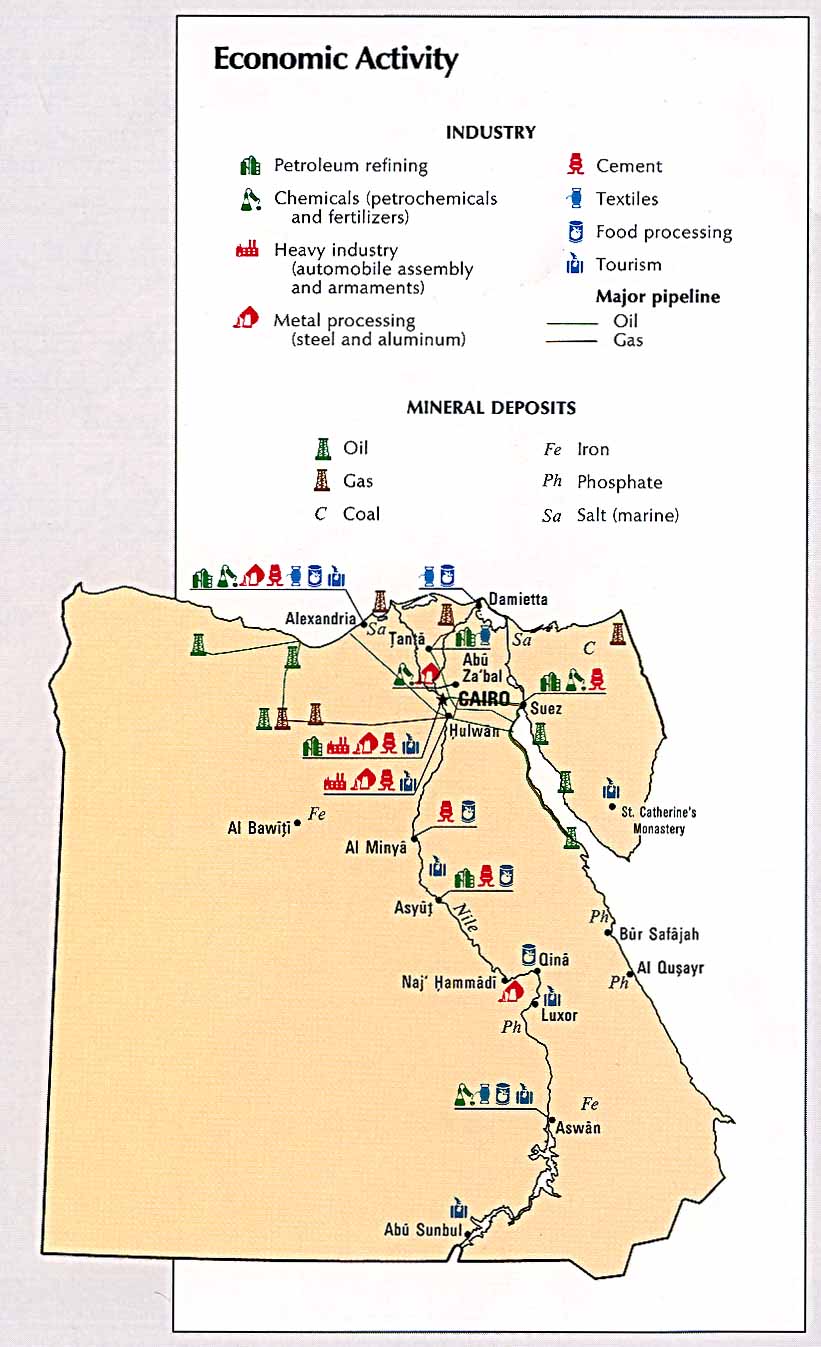
Egypt - Economic Activity from the CIA Atlas of the Middle East 1993(107K)
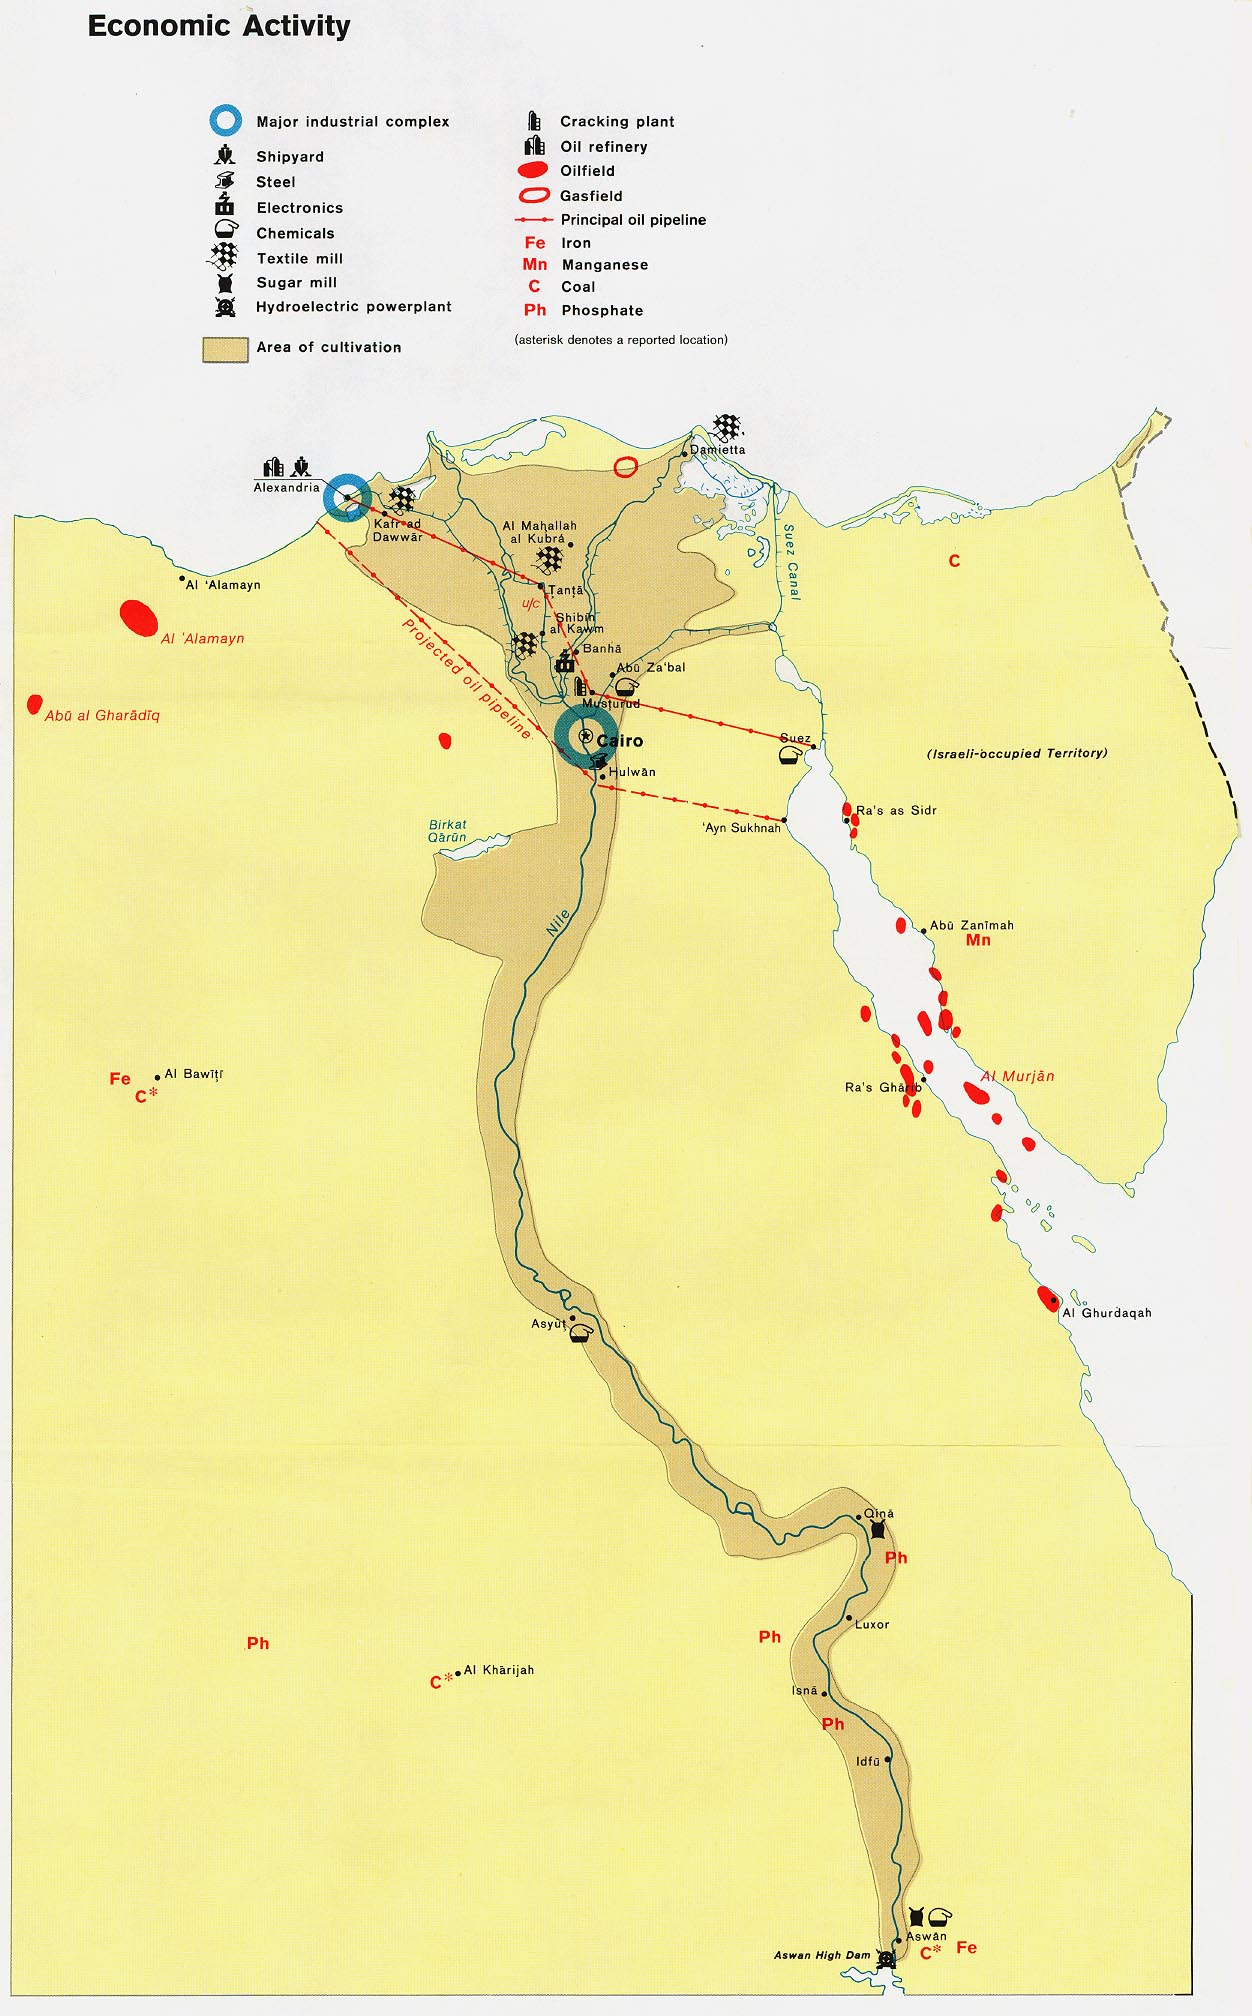
Egypt - Economic Activity from Map No. 500648 1971 (266K)
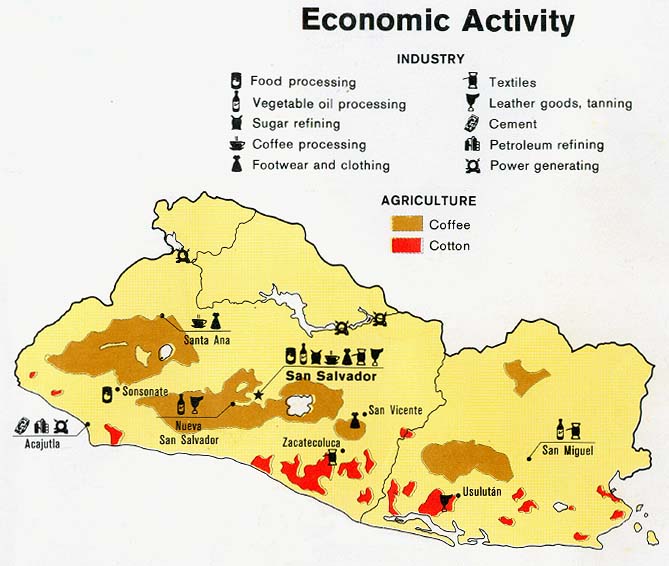
El Salvador - Economic Activity from Map No. 504473 1980 (87K)
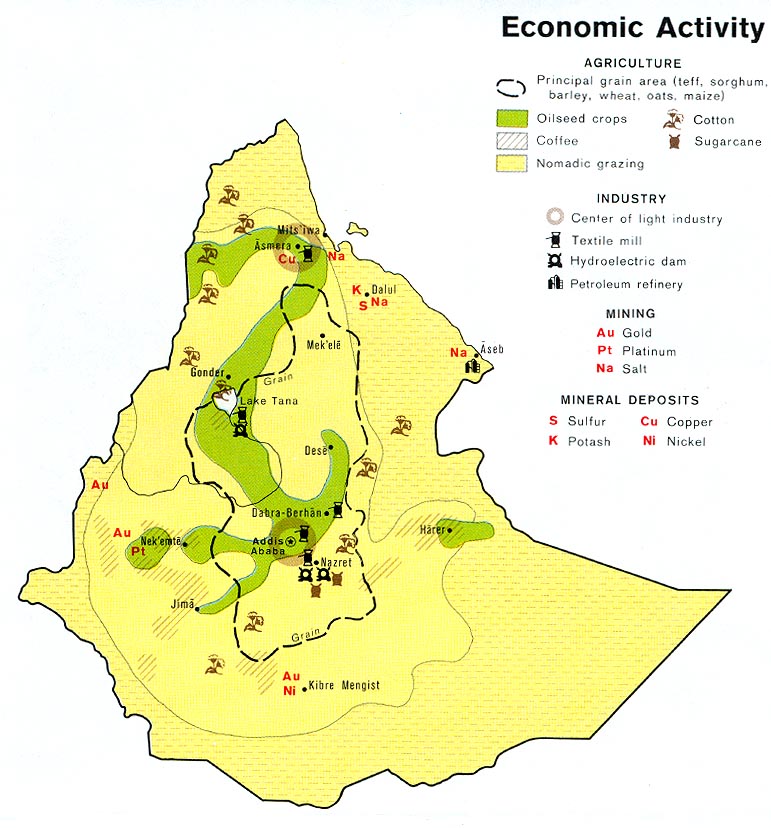
Ethiopia - Economic Activity from Map No. 503188 1976 (138K)
Finland - Industry from Map No. 58419 1969 (89K)
France - Industrial Centers from Map No. 500197 1972 (132K)
French Guiana - Economic Activity from Map No. 500460 1972 (70K)
Gabon - Economic Activity from Map No. 56867 1968 (136K)
Germany, Eastern - Economic Activity from the CIA Atlas of Eastern Europe 1990 (133K)
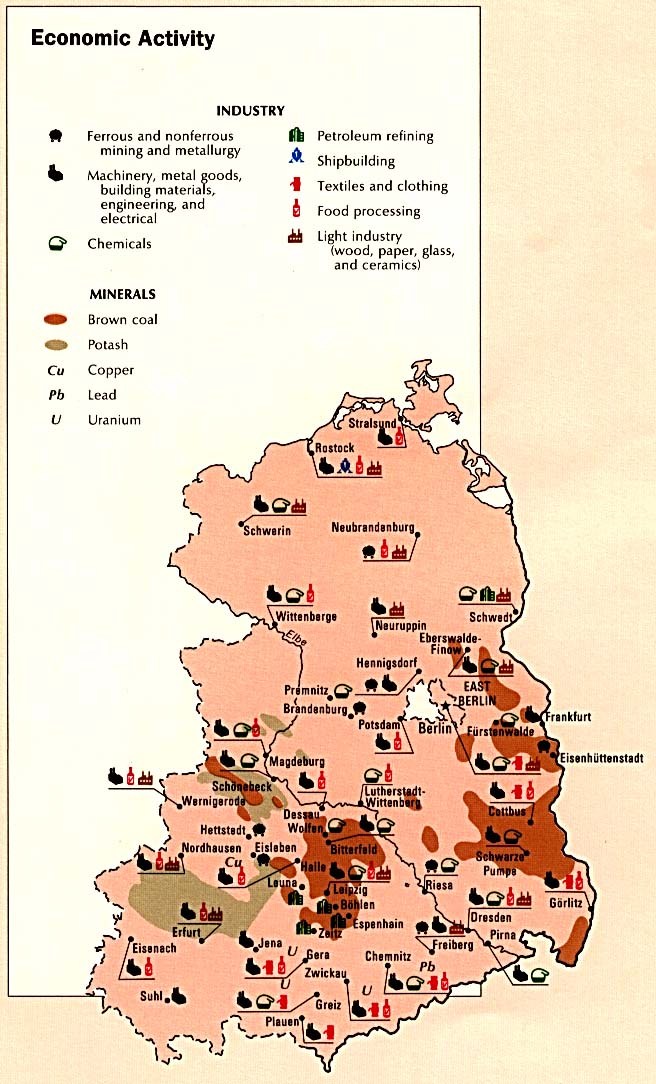
Germany, Eastern - Industrial Production from Map No. 504708 1981 (131K)
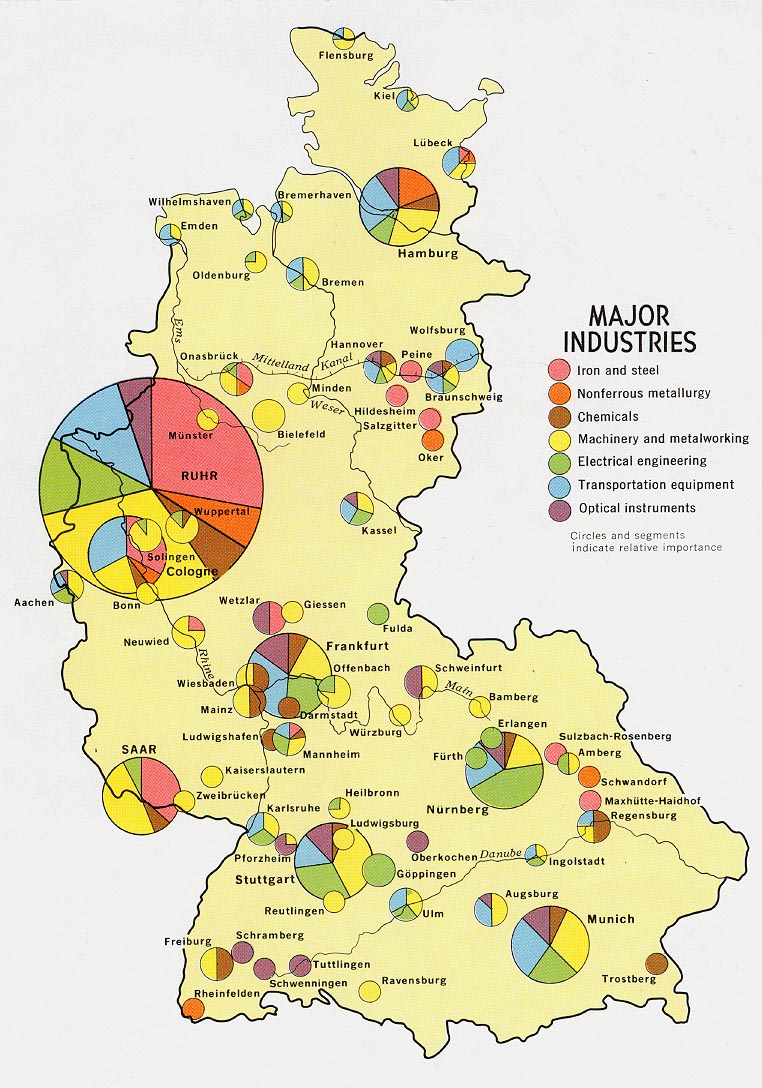
Germany, Western - Major Industry from Map No. 500470 1972 (212K)
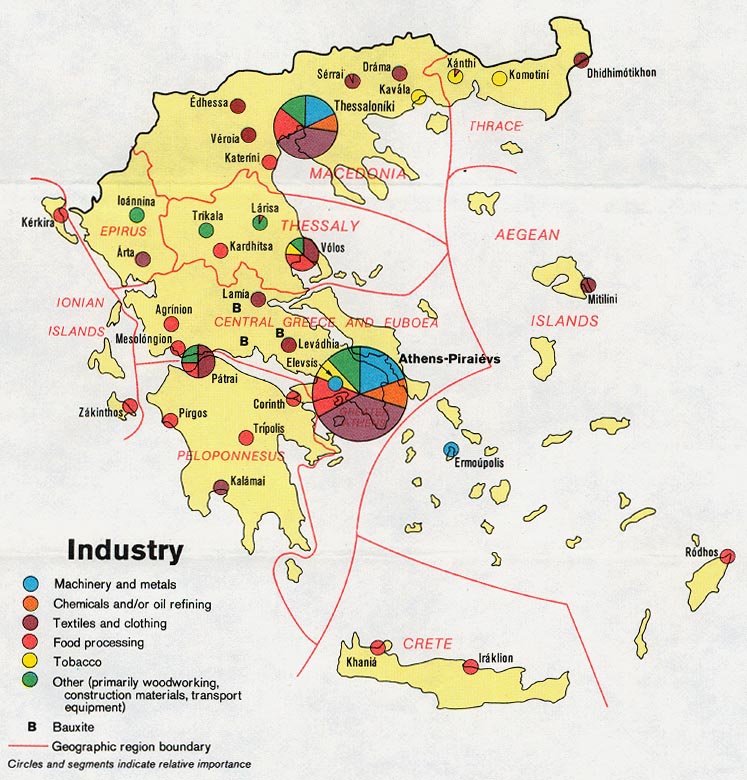
Greece - Industry from Map No. 501684 1973 (163K)
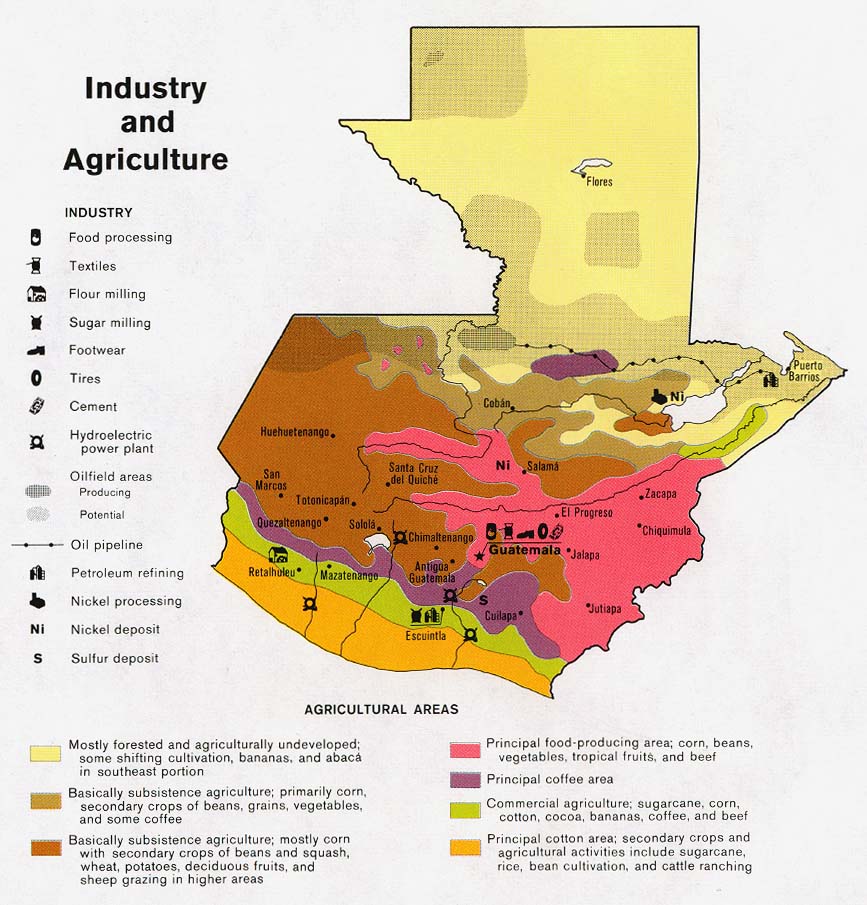
Guatemala - Industry and Agriculture from Map No. 504829 1983 (161K)
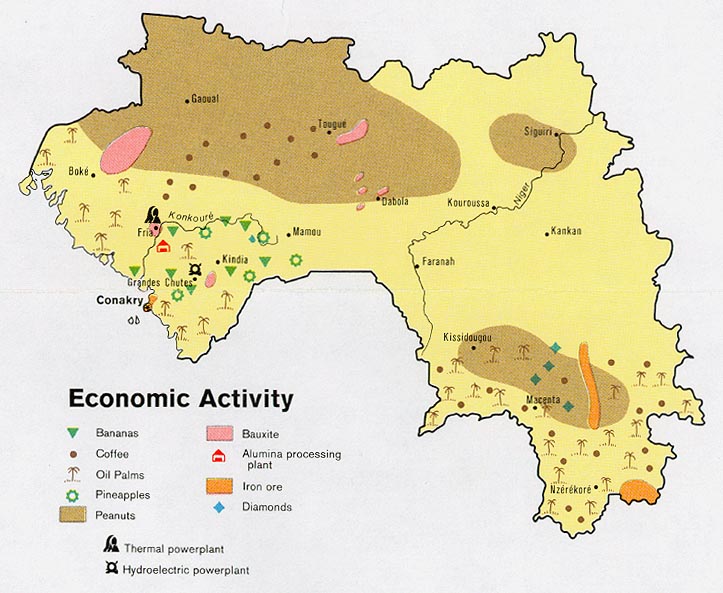
Guinea - Economic Activity from Map No. 501172 1973 (107K)
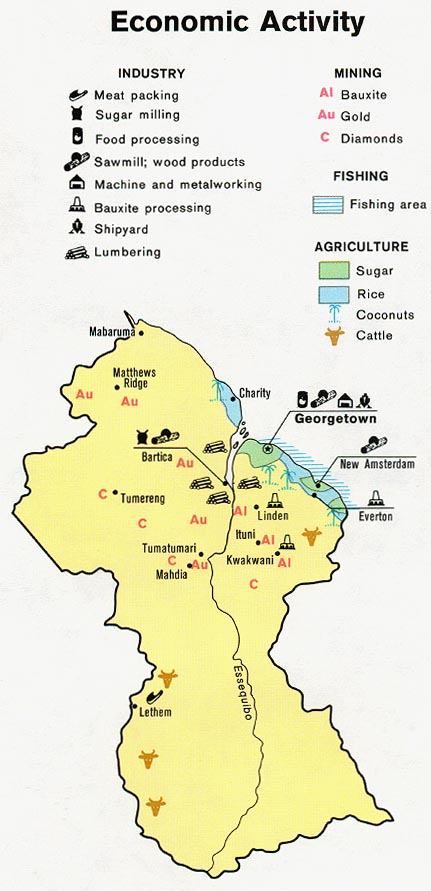
Guyana - Economic Activity from Map No. 500987 1973 (86K)
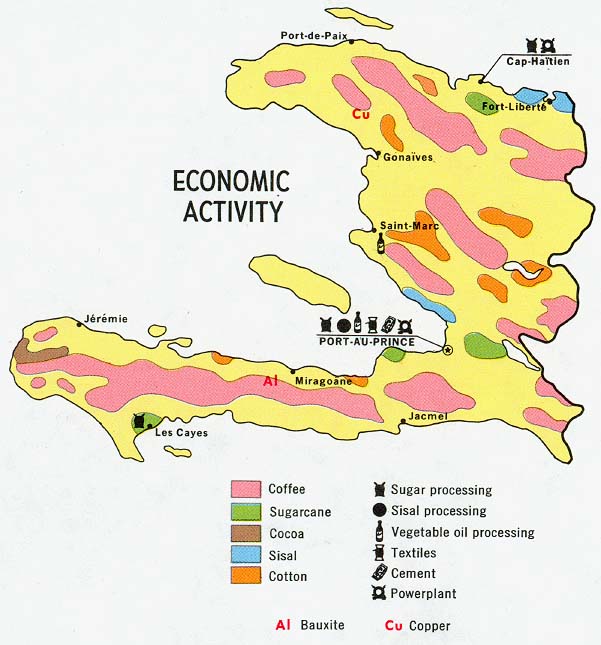
Haiti - Economic Activity from Map No. 77972 1970 (90K)
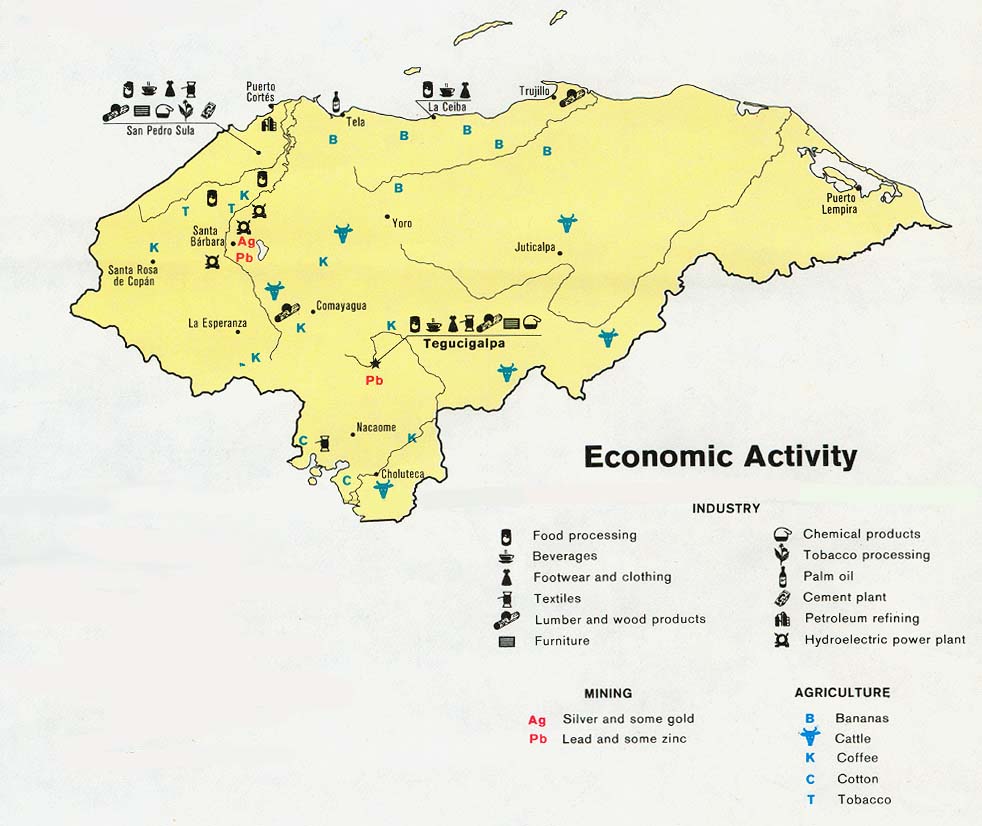
Honduras - Economic Activity from Map No. 504929 1983 (110K)
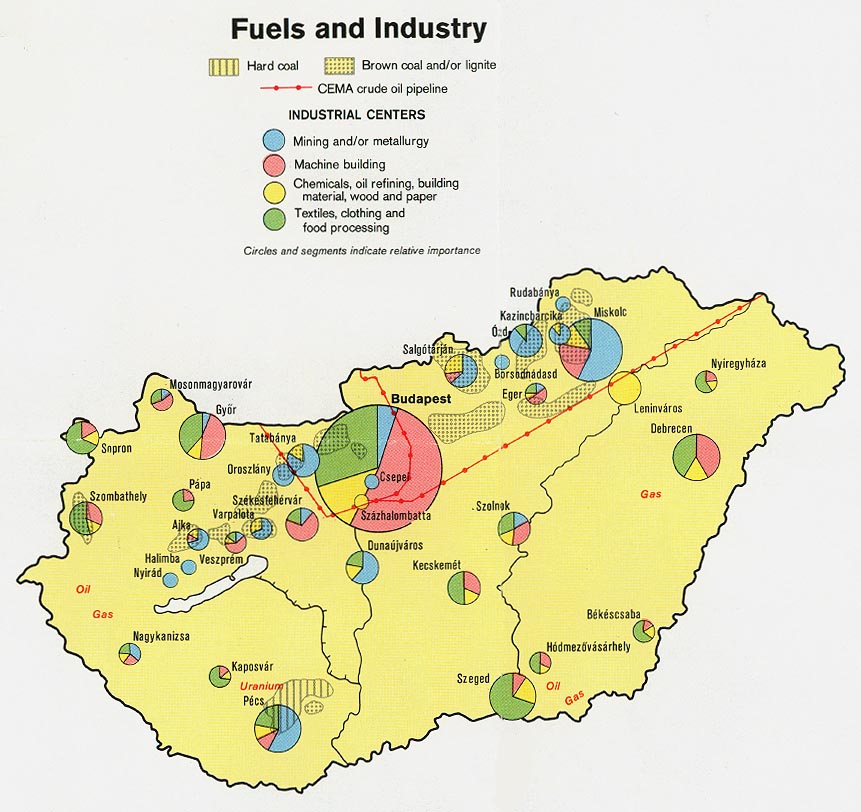
Hungary - Industry from Map No. 501074 1973 (147K)
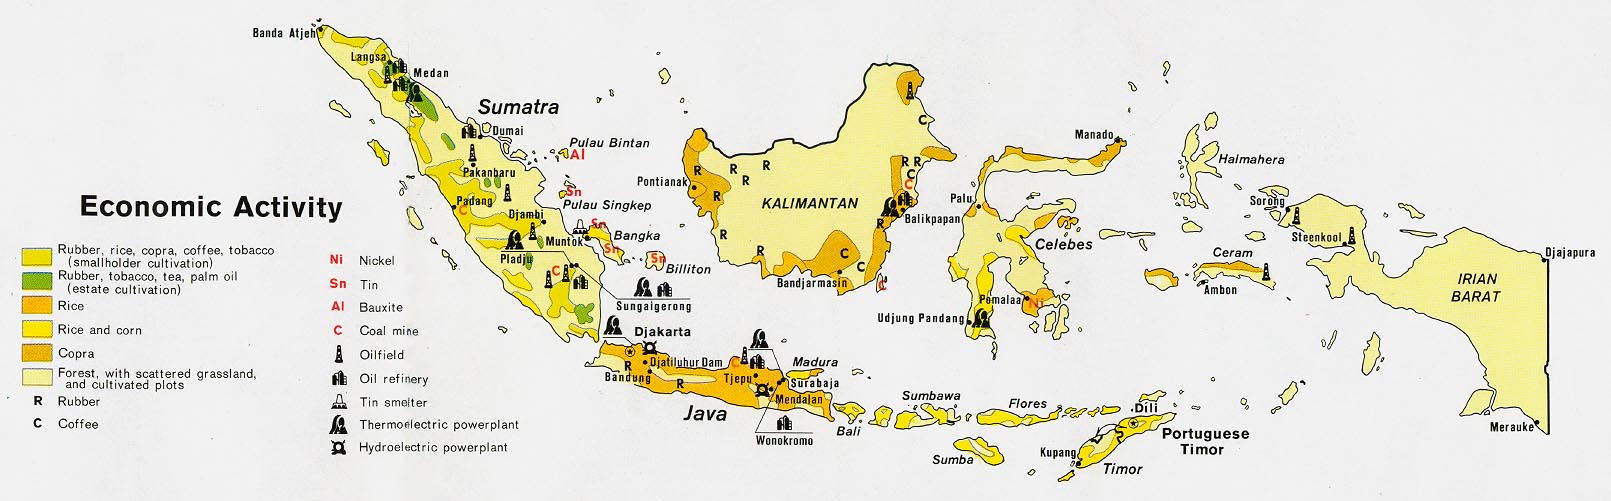
Indonesia - Economic Activity from Map No. 500869 1972 (149K)
Iran - Economic Activity from the CIA Atlas of the Middle East 1993 (118K)
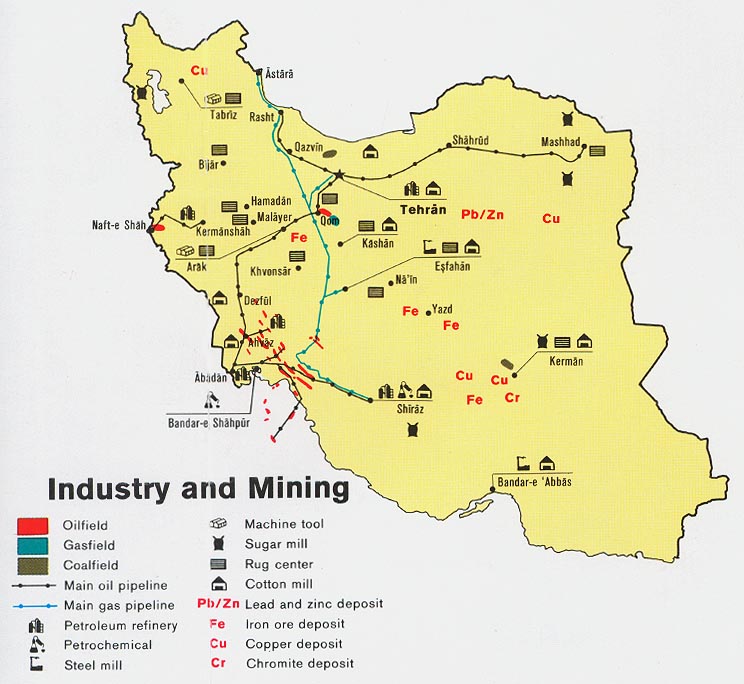
Iran - Industry and Mining from Map No. 503828 1978 (109K)
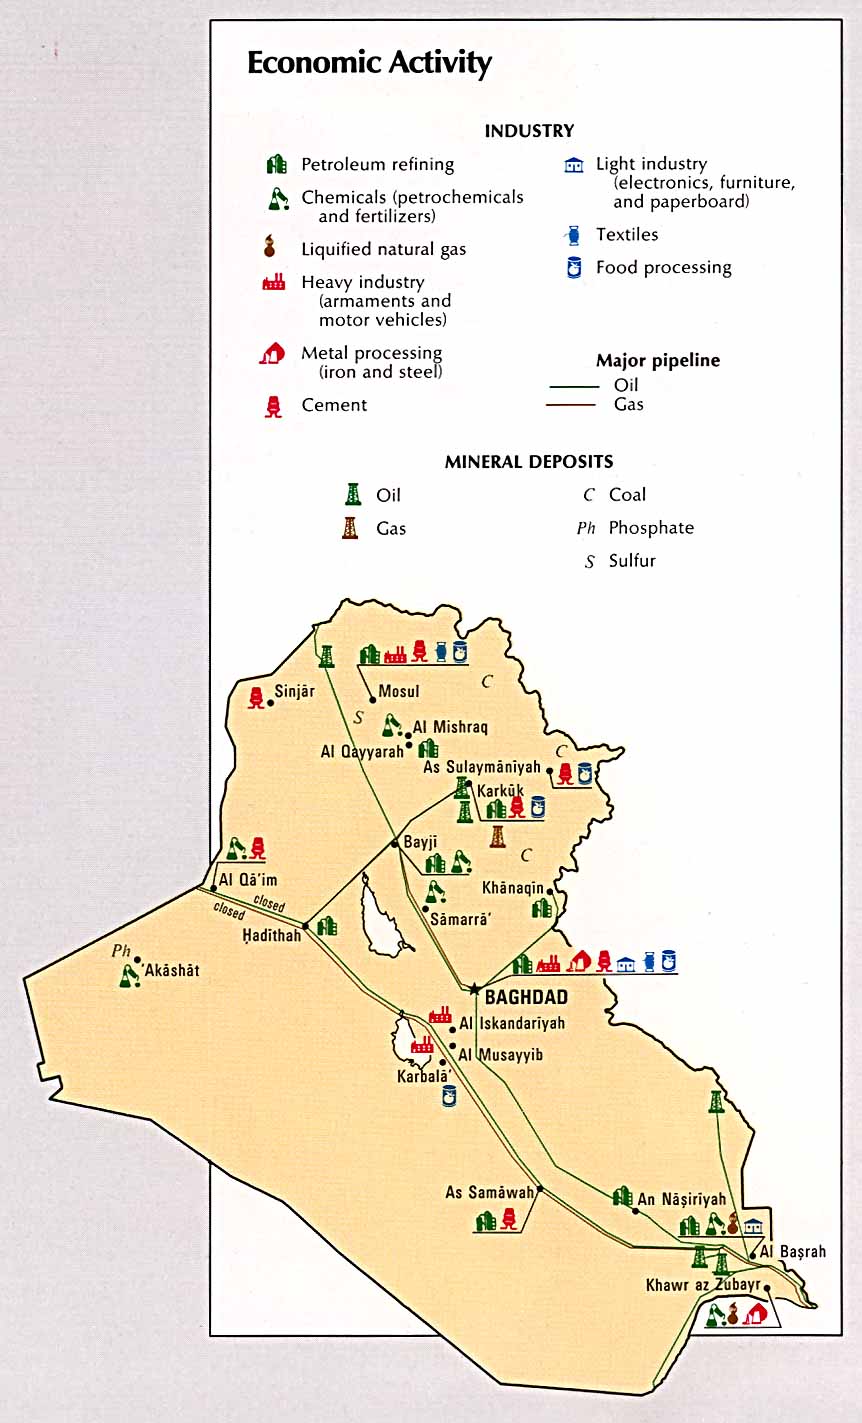
Iraq - Economic Activity from the CIA Atlas of the Middle East 1993 (115K)
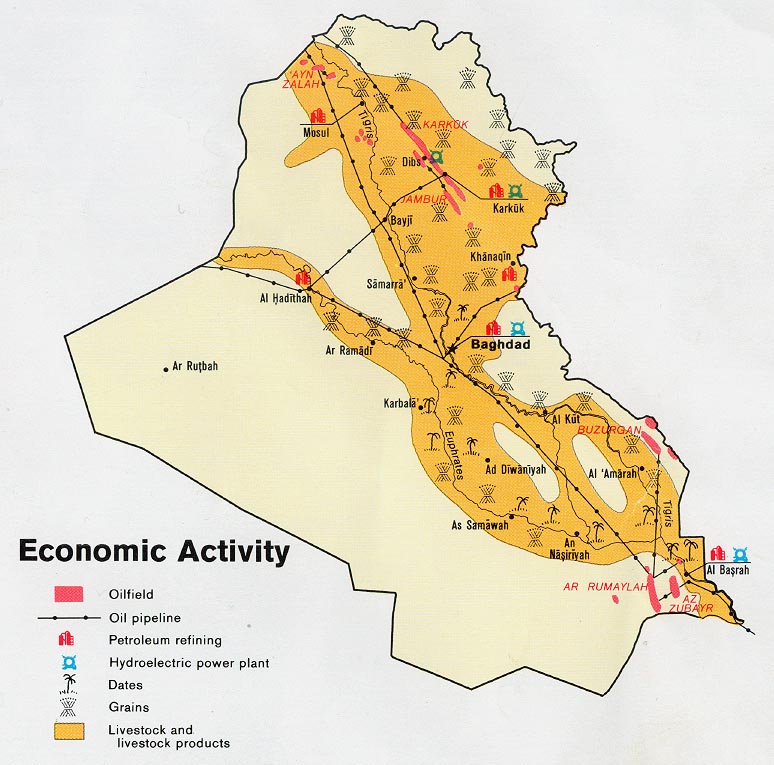
Iraq - Economic Activity from Map No. 503930 1978 (134K)
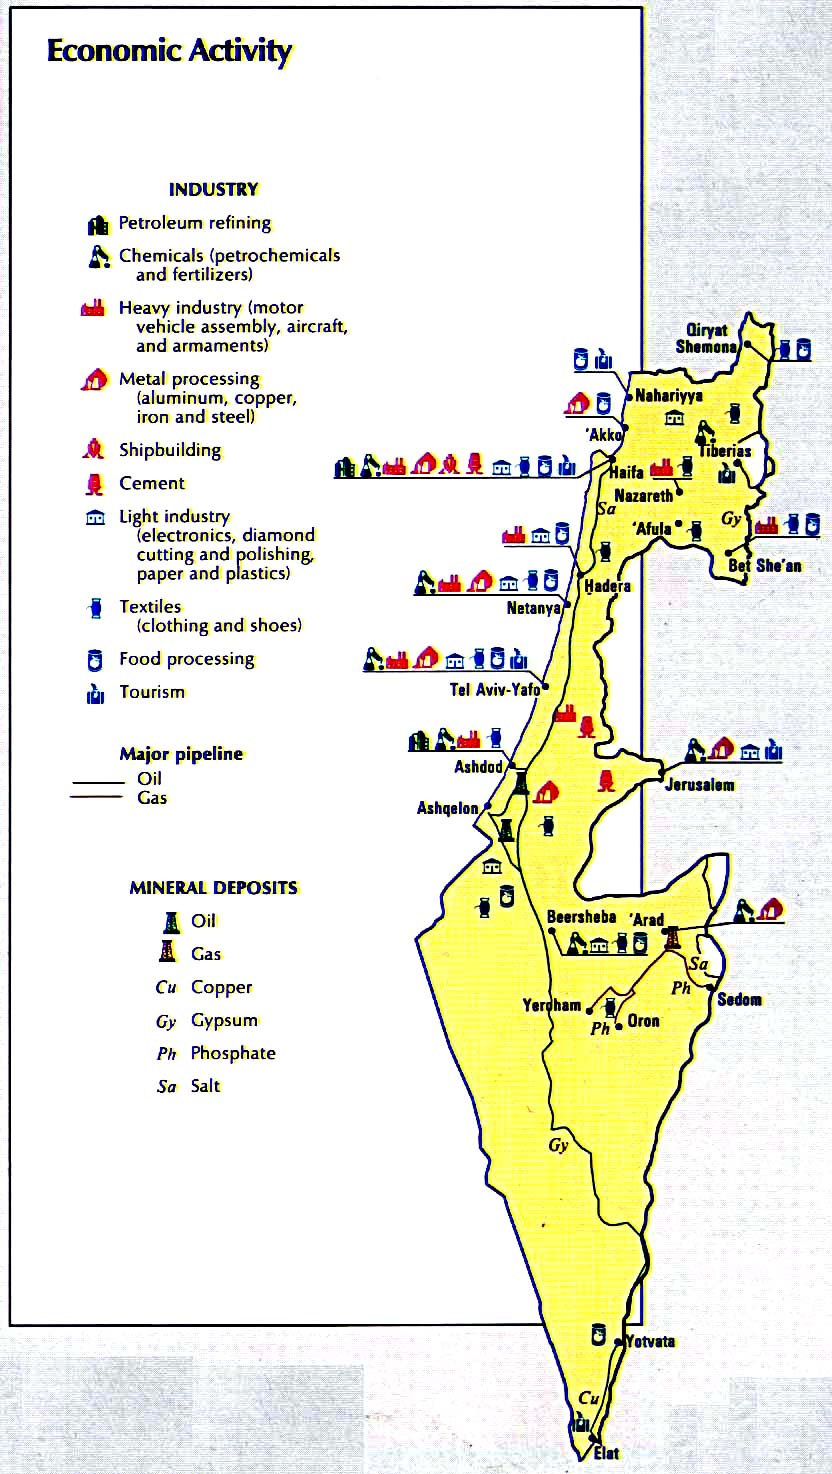
Israel - Economic Activity from the CIA Atlas of the Middle East 1993 (196K)
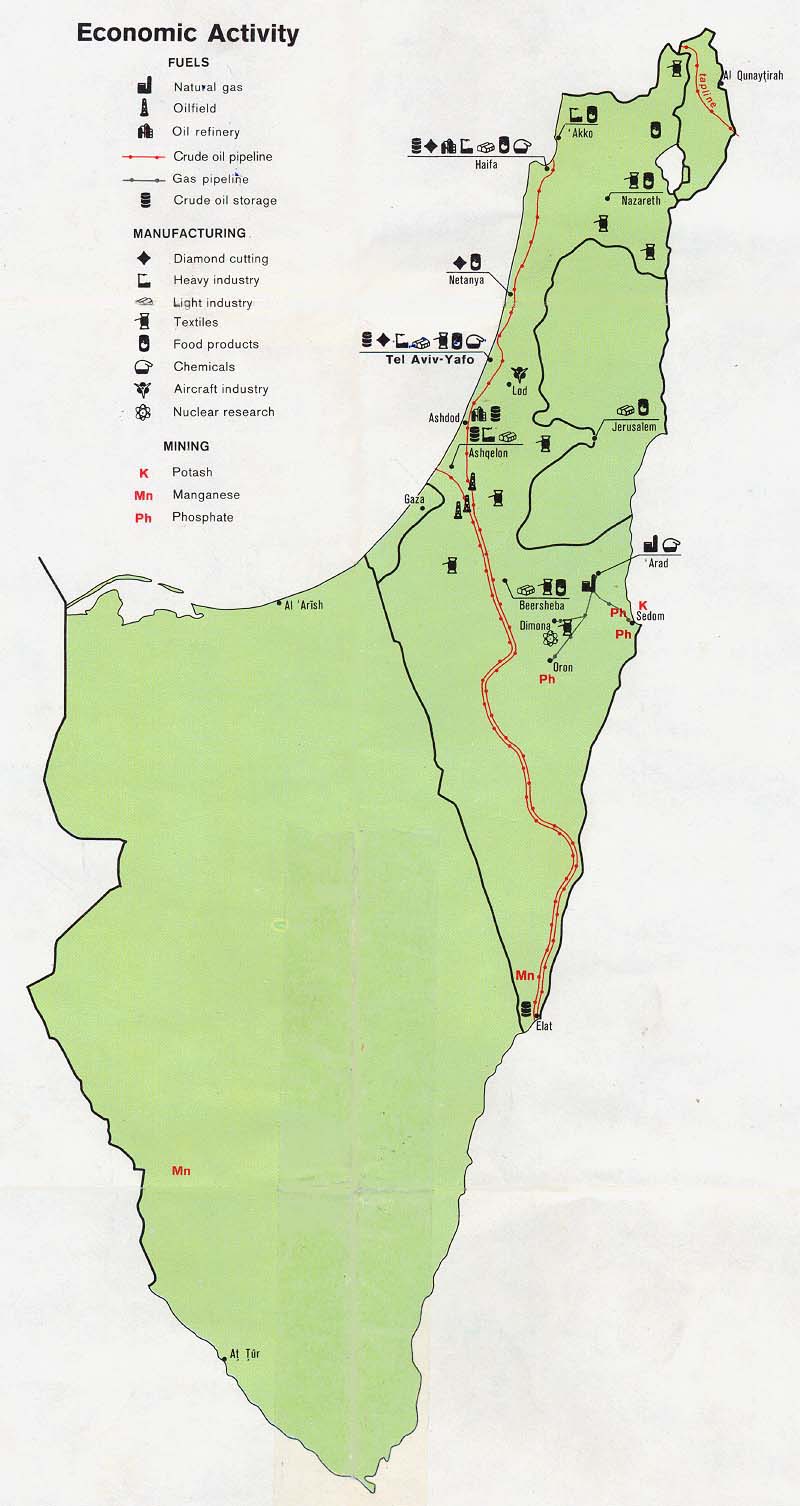
Israel - Economic Activity from Map No. 53499 1978 (113K)
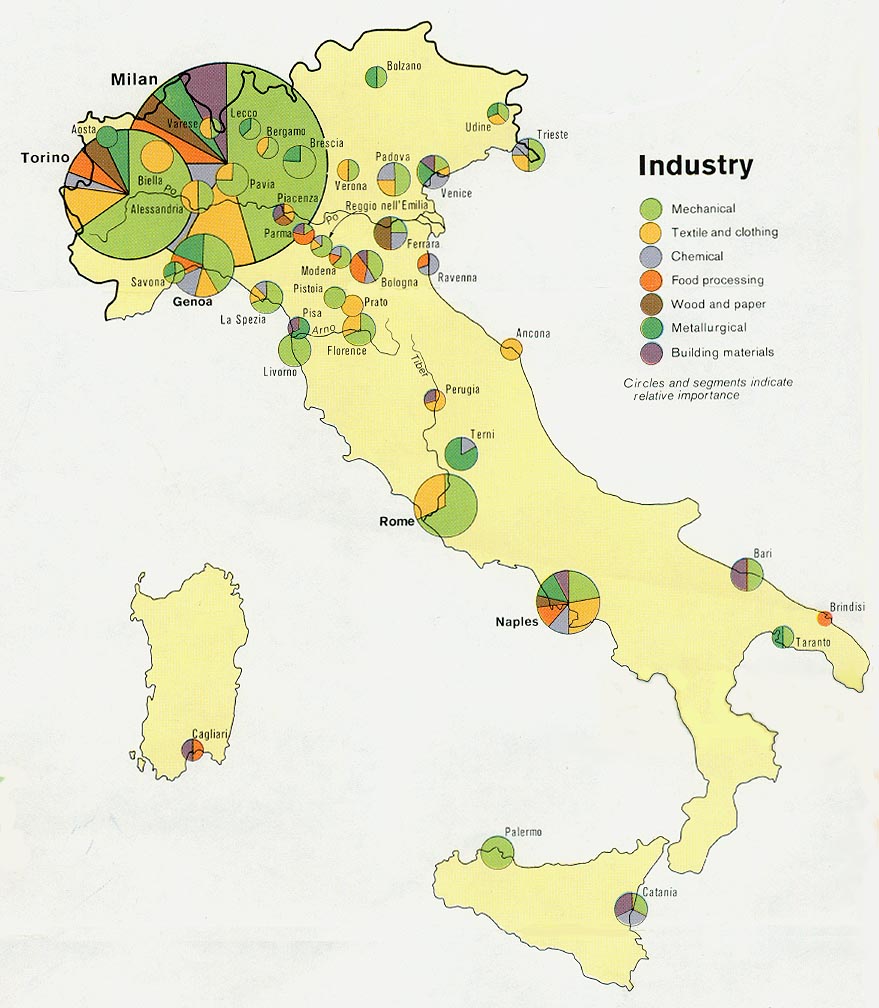
Italy - Industry from Map No. 501445 1972 (145K)
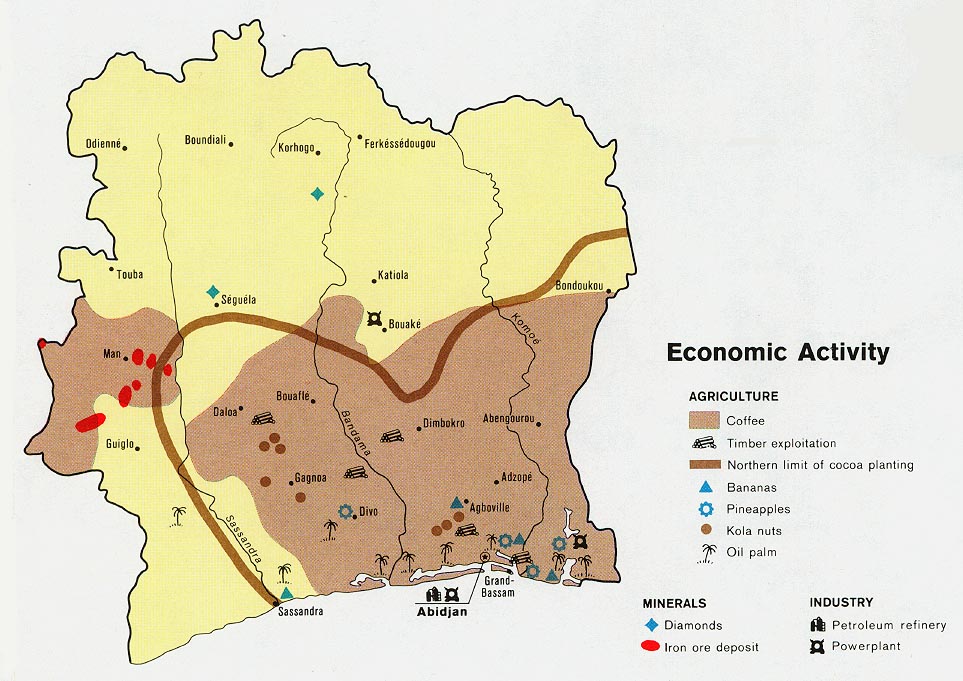
Ivory Coast - Economic Activity from Map No. 500455 1972 (147K)
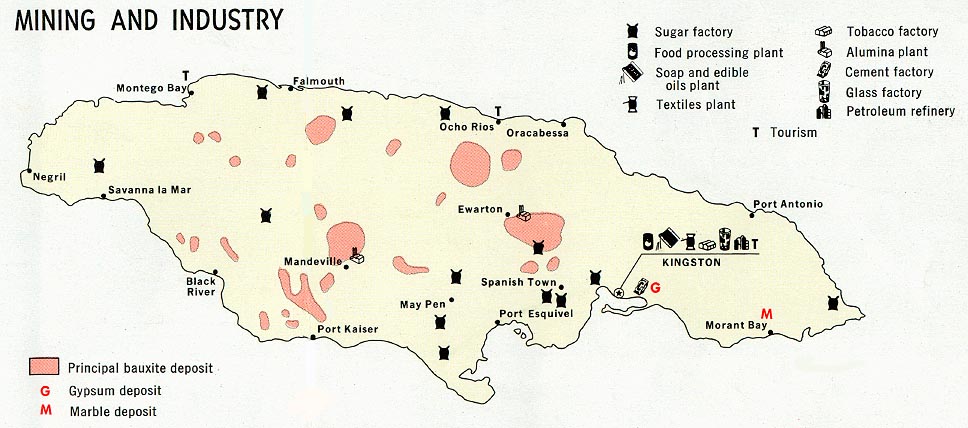
Jamaica - Mining and Industry from Map No. 58780 1968 (104K)
Japan - Industry and Power from Map No. 78643 1971 (150K)
Jordan - Economic Activity from the CIA Atlas of the Middle East 1993 (89K)
Jordan - Land Use and Economic Activity from Map No. 505911 1978 (134K)
Kazakstan, Kyrgyzstan, Tajikistan, Turkmenistan, and Uzbekistan: Industrial Activity 1996 from Kazakstan, Kyrgyzstan, Tajikistan, Turkmenistan, and Uzbekistan: Country Studies. 1997 (151K)
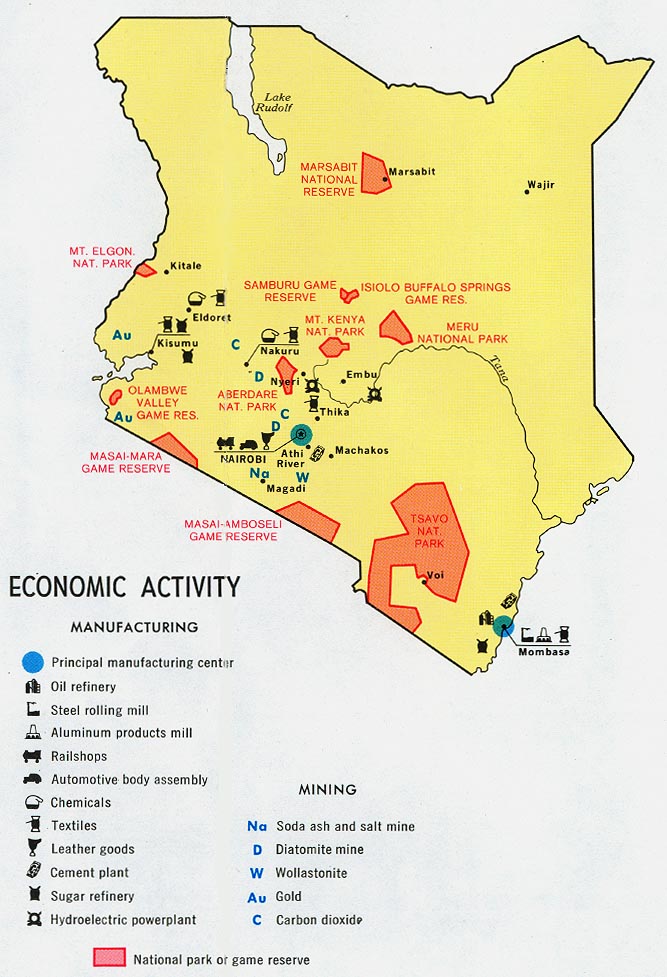
Kenya - Economic Activity from Map No. 501721 1974 (137K)
Korea [North] - Economic Activity from Map No. 500773 1972 (140K)
Korea [South] - Economic Activity from Map No. 501879 1973 (149K)
Kuwait - Economic Activity from the CIA Atlas of the Middle East 1993 (138K)
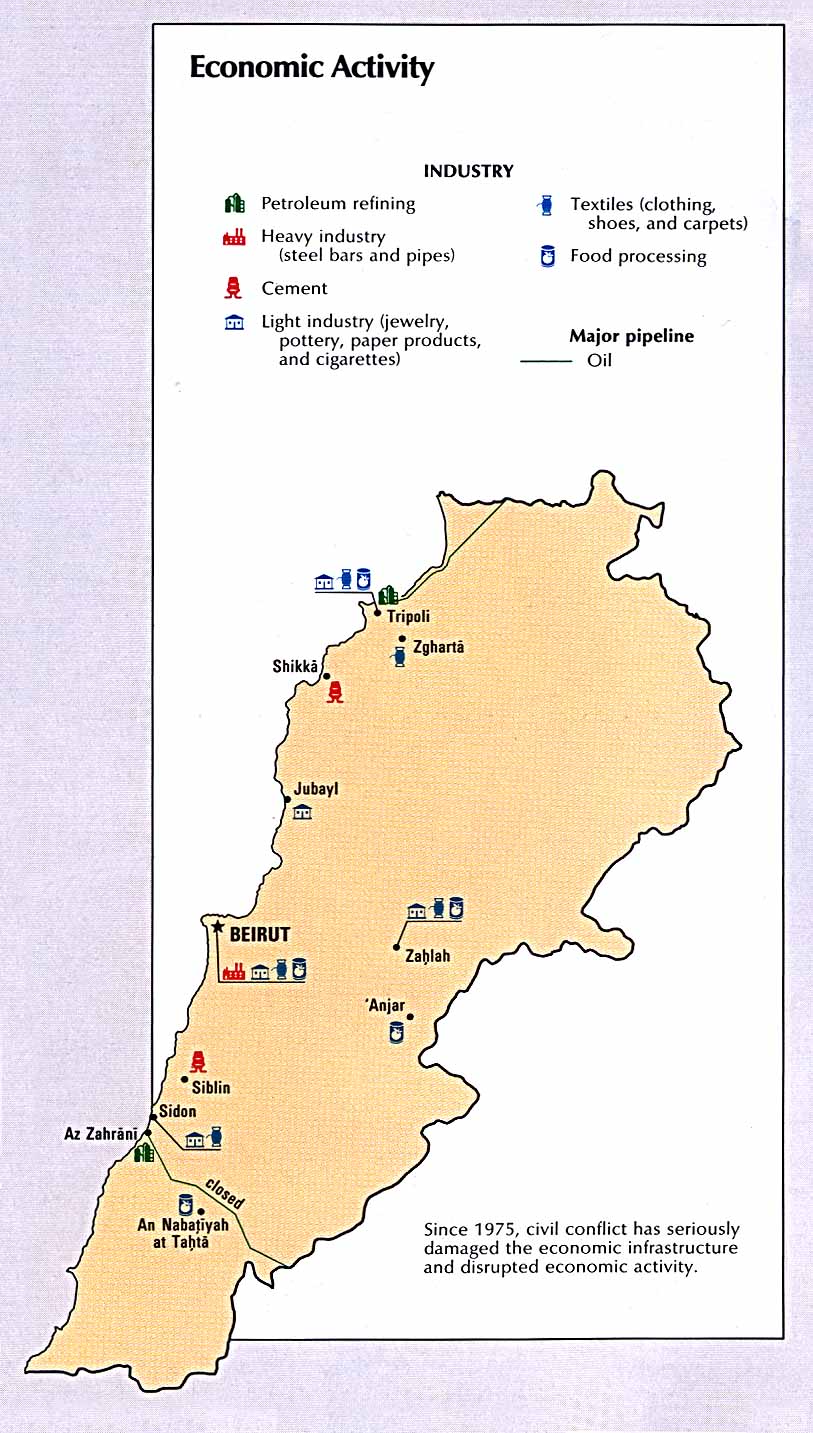
Lebanon - Economic Activity from the CIA Atlas of the Middle East 1993 (148K)
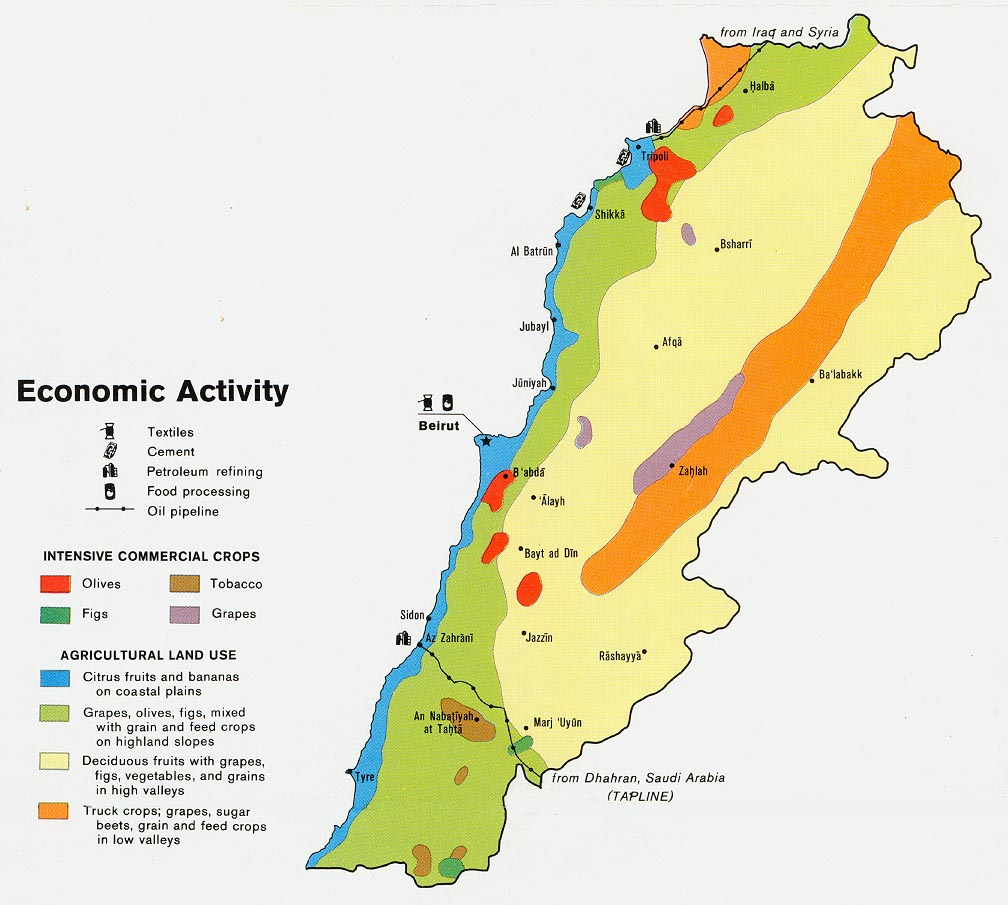
Lebanon - Economic Activity from Map No. 503804 1968 (104K)
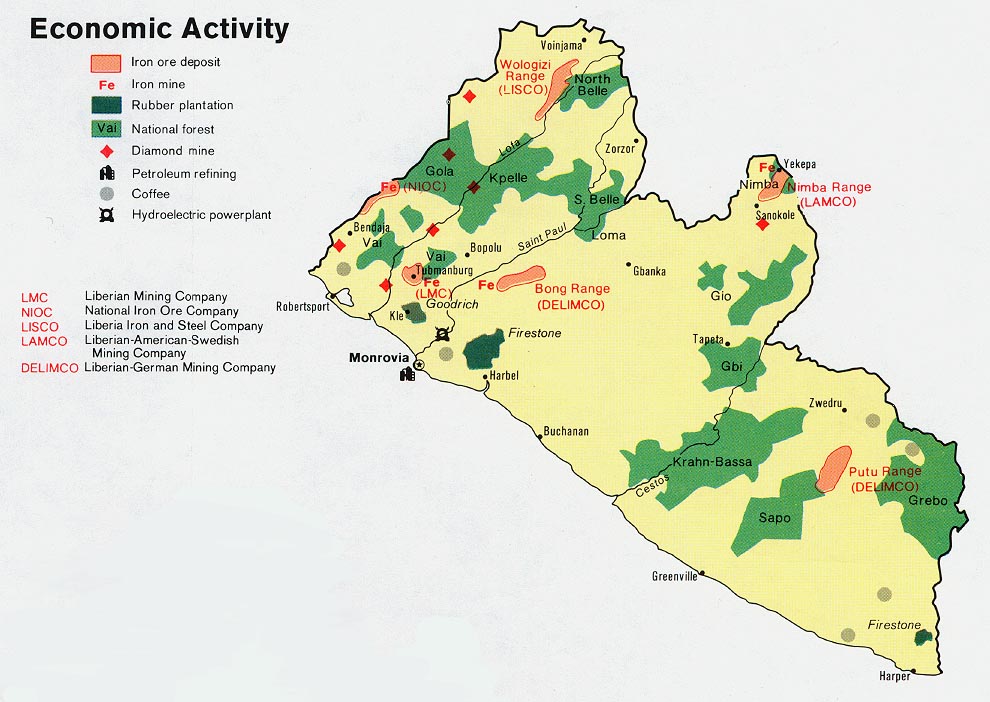
Liberia - Economic Activity from Map No. 501556 1973 (143K)
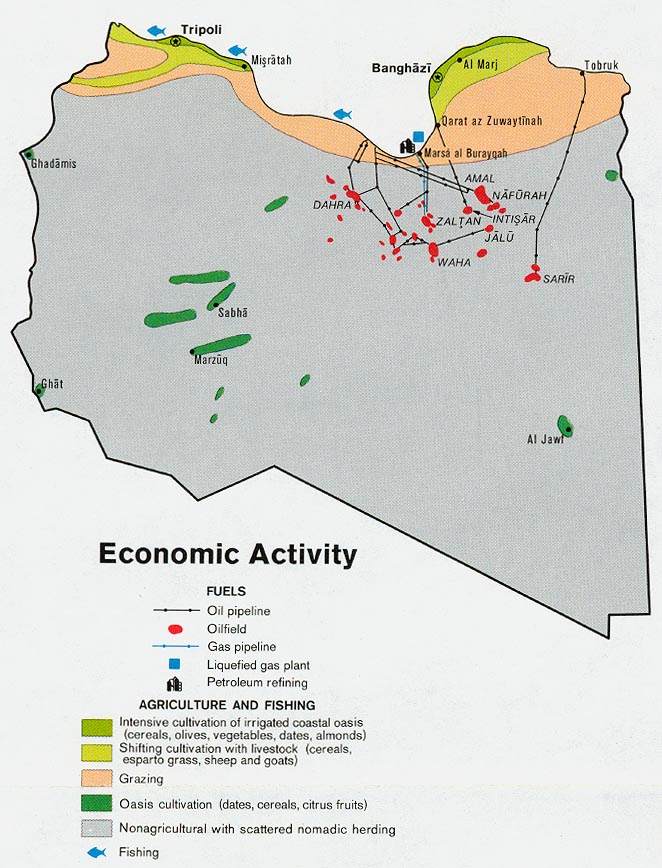
Libya - Economic Activity from Map No. 501564 1974 (140K)
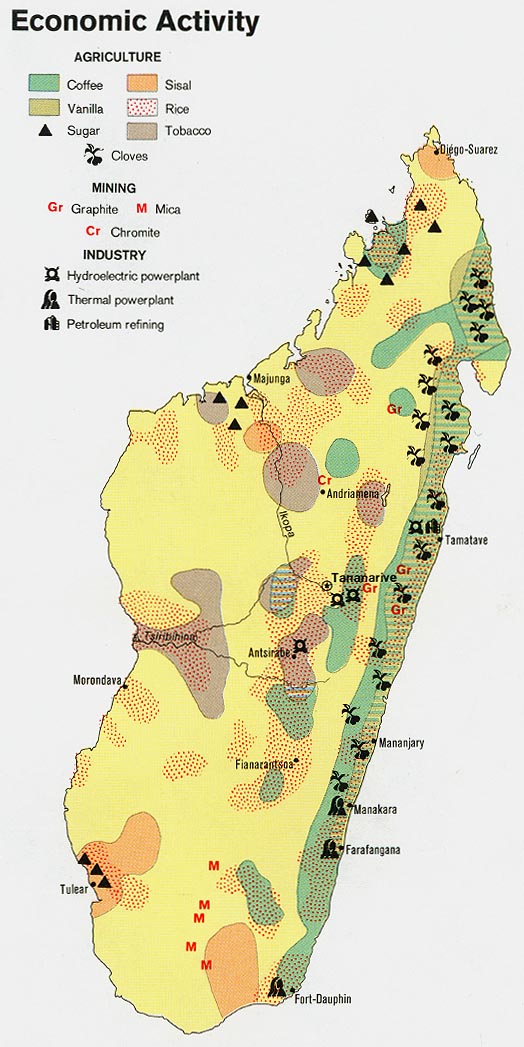
Madagascar - Economic Activity 1973 (134K)
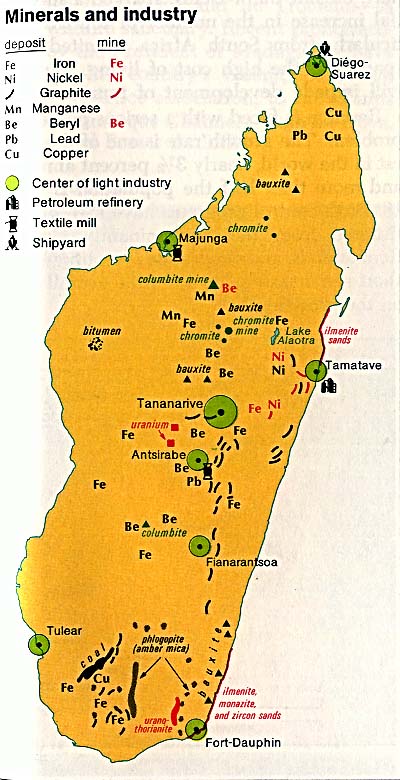
Madagascar - Minerals and Industry from The Indian Ocean Atlas 1976 (76K)
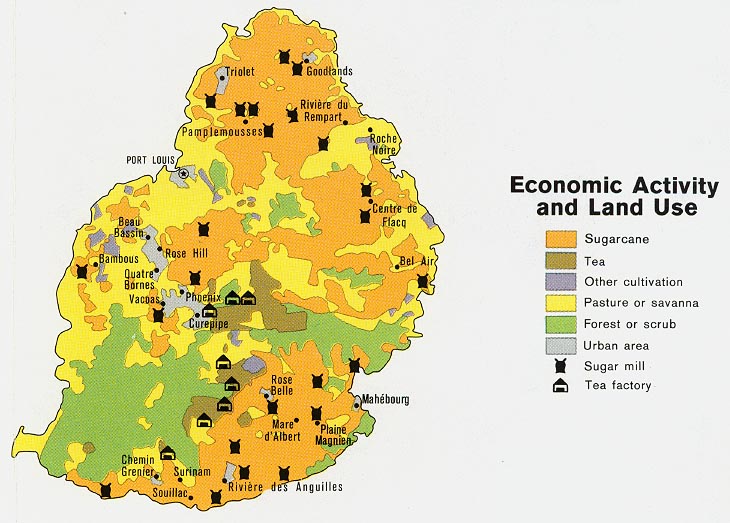
Mauritius - Economic Activity and Land Use from Map No. 500430 1972 (114K)
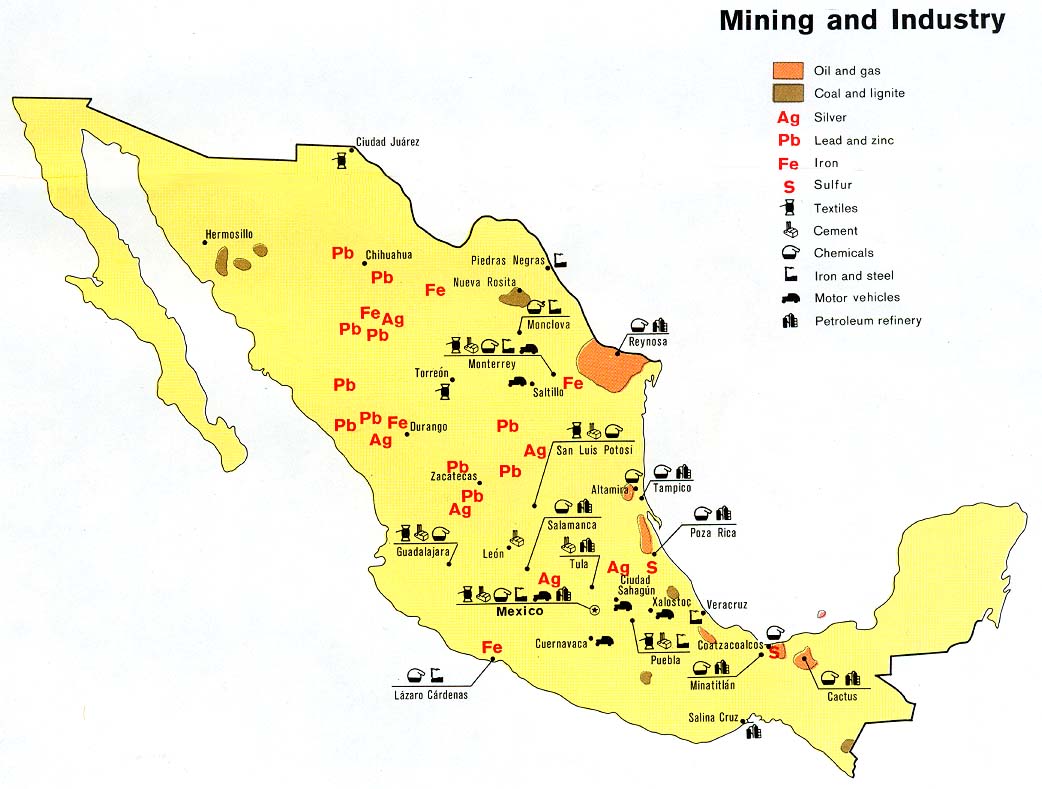
Mexico - Mining and Industry from Map No. 503497 1978 (122K)
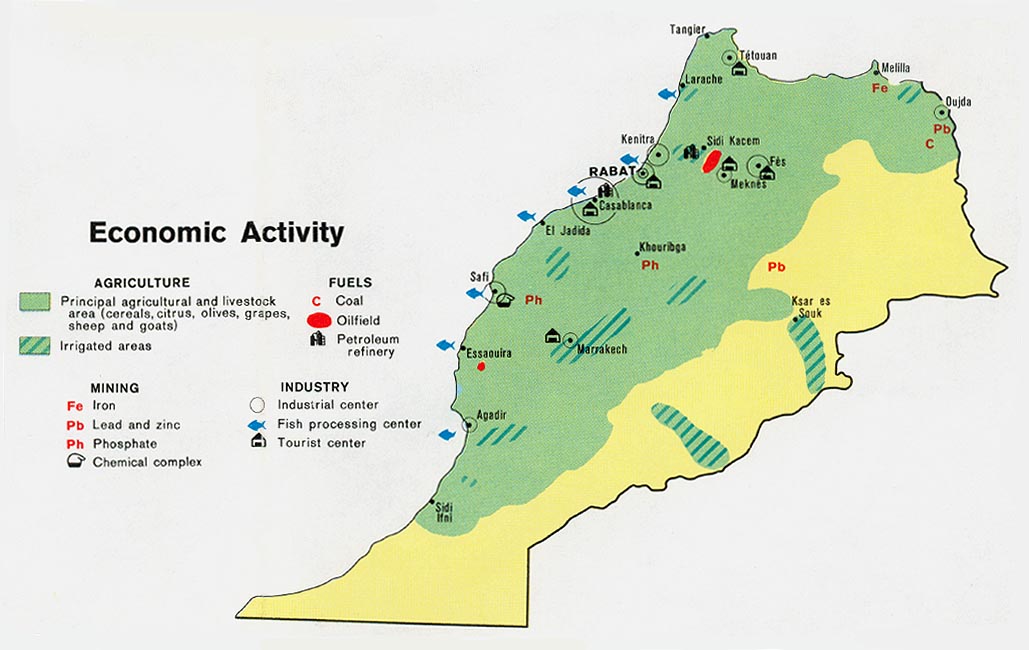
Morocco - Economic Activity from Map No. 500977 1973 (106K)
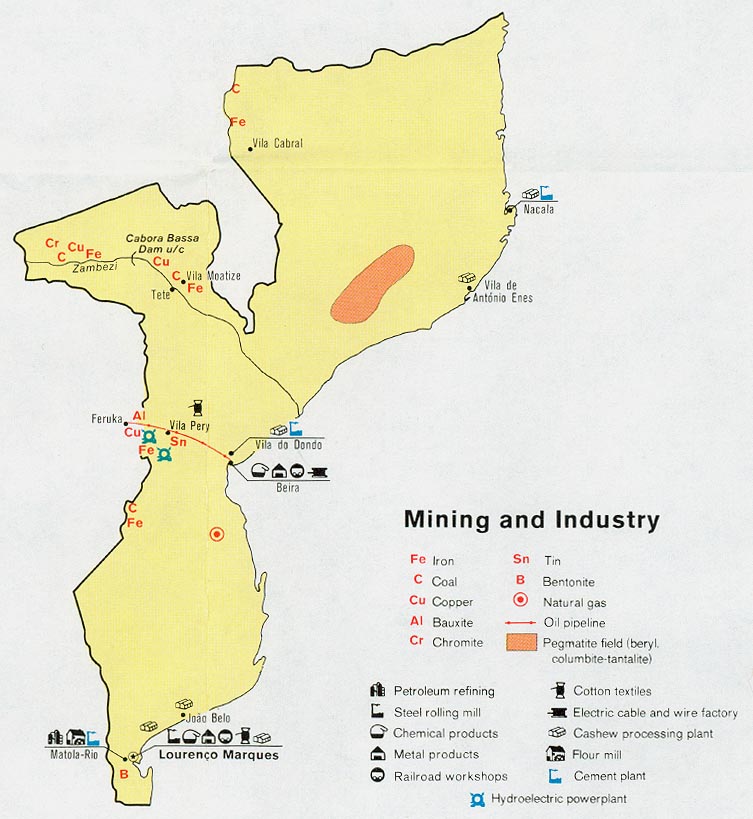
Mozambique - Mining and Industry from Map No. 501370 1973 (113K)
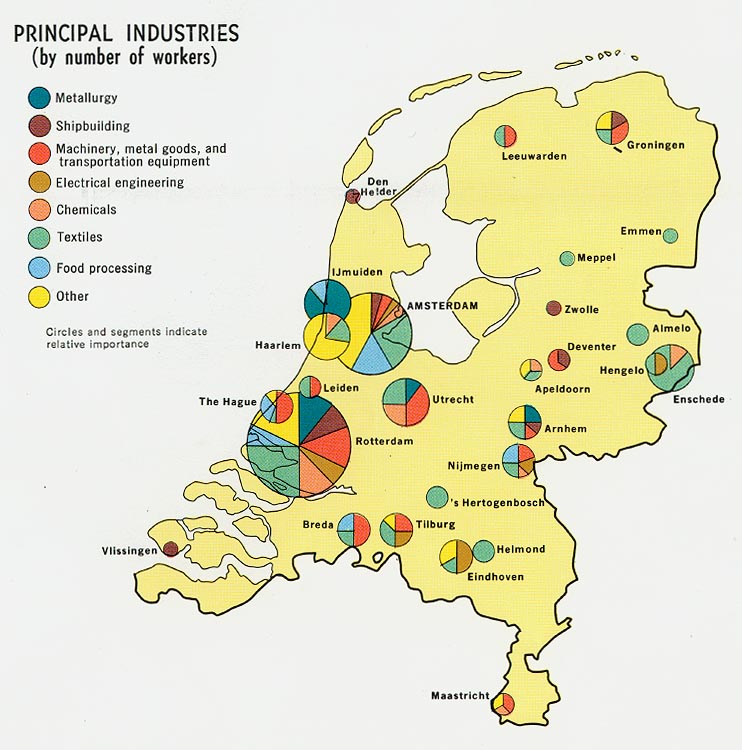
Netherlands - Principal Industries from Map No. 76863 1970 (125K)
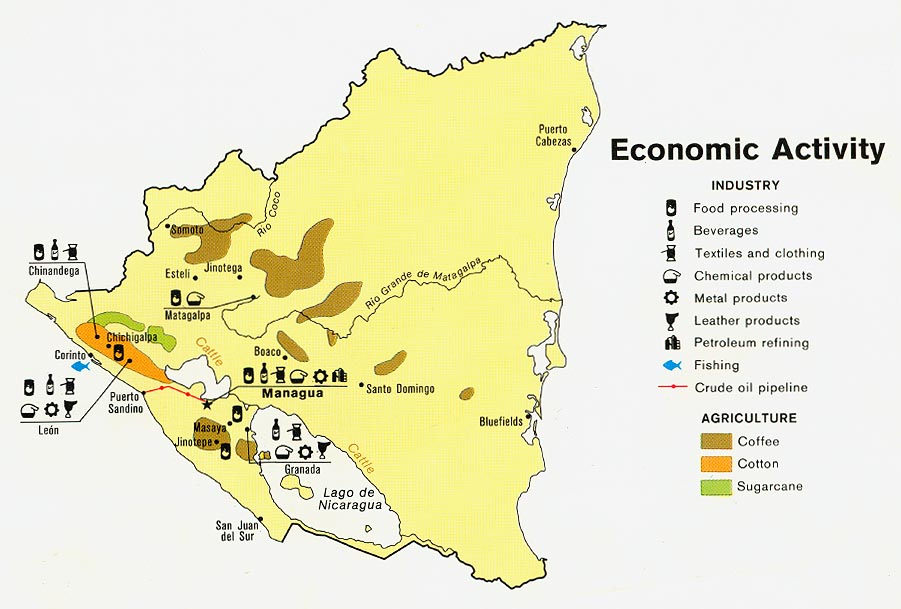
Nicaragua - Economic Activity from Map No. 504012 1979 (107K)
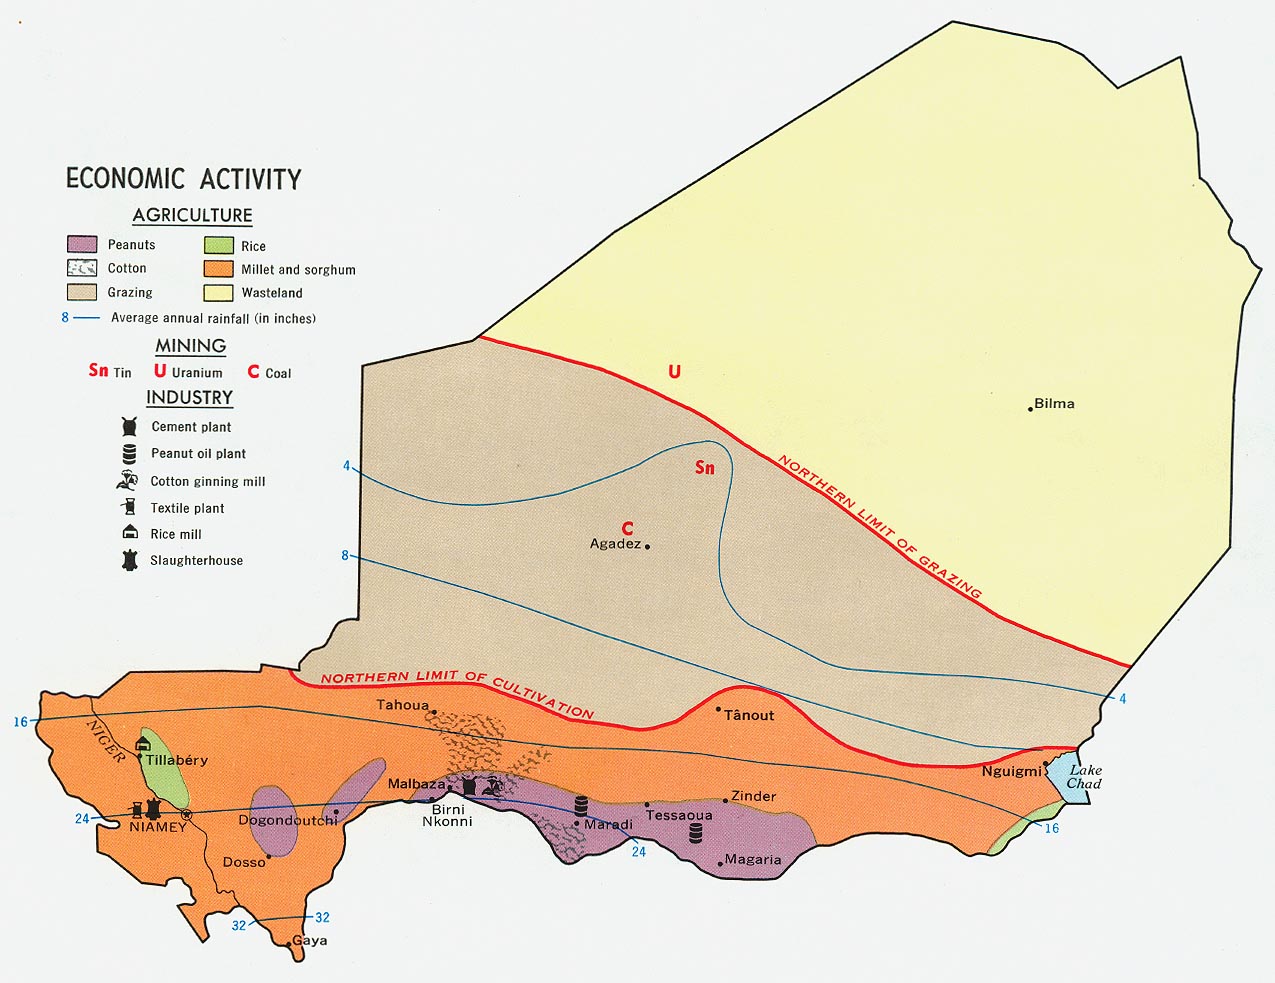
Niger - Economic Activity from Map No. 59203 1969 (202K)
Nigeria - Economic Activity from Map No. 504014 1979 (163K)
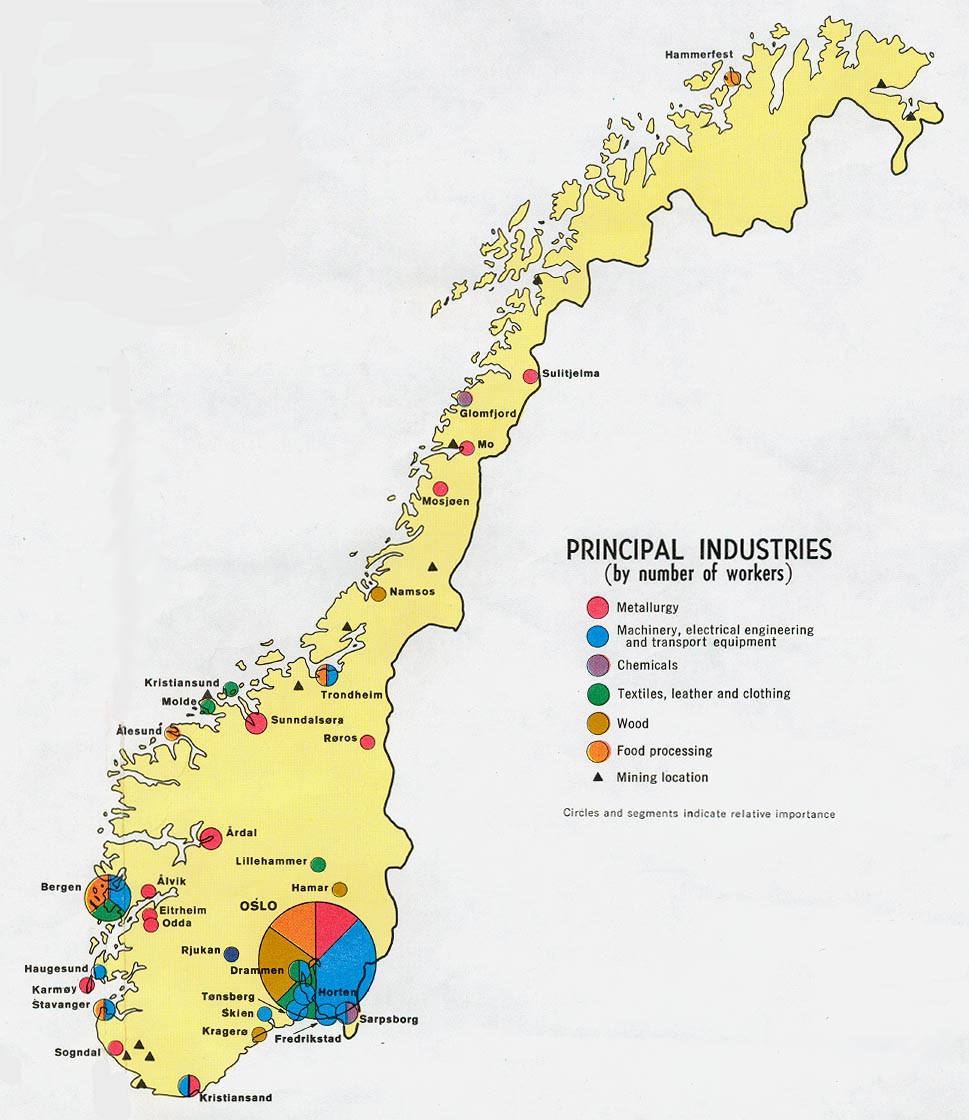
Norway - Principal Industries from Map No. 500007 1971 (155K)
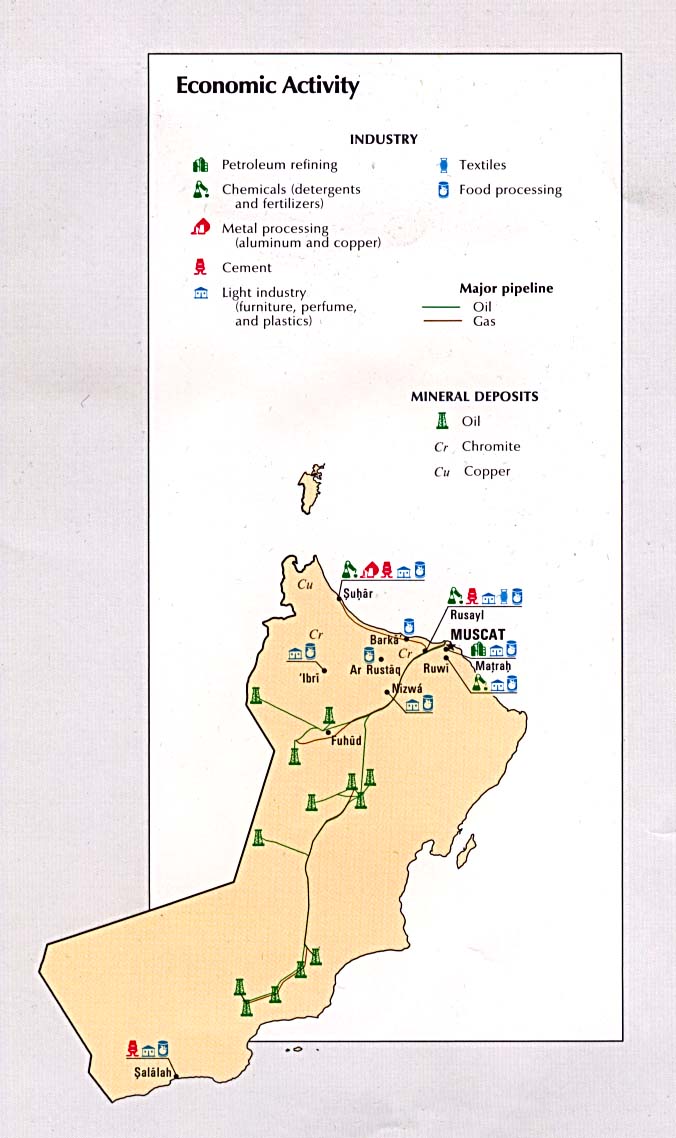
Oman - Economic Activity from the CIA Atlas of the Middle East 1993 (124K)
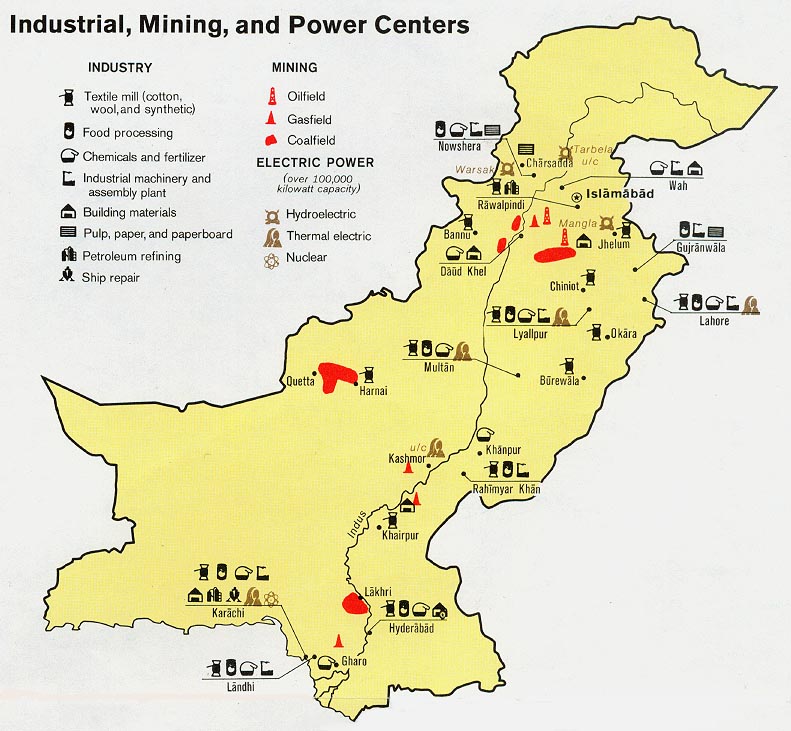
Pakistan - Industry, Mining, Power Centers from Map No. 501383 1973 (137K)
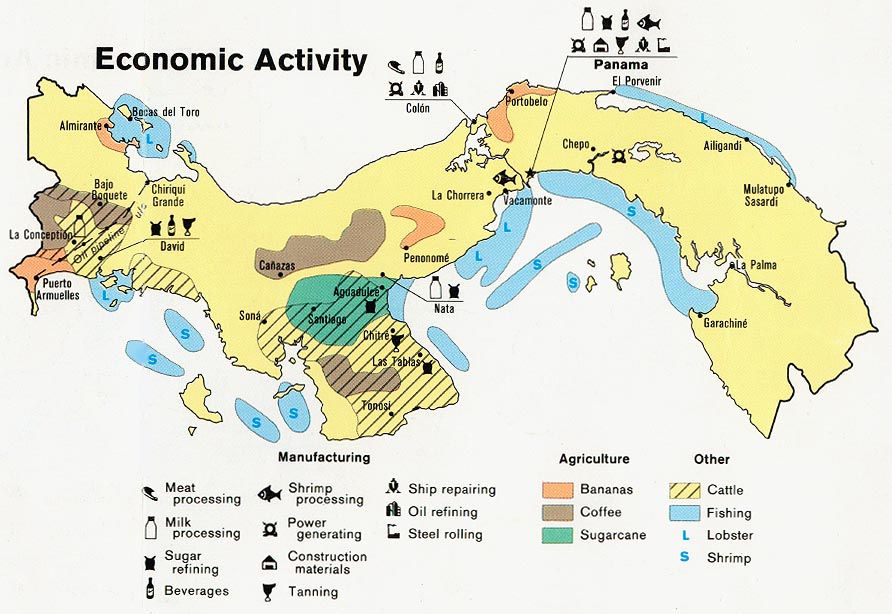
Panama - Economic Activity from Map No. 545665 1981 (137K)
Peru - Economic Activity from Map No. 76868 1970 (182K)
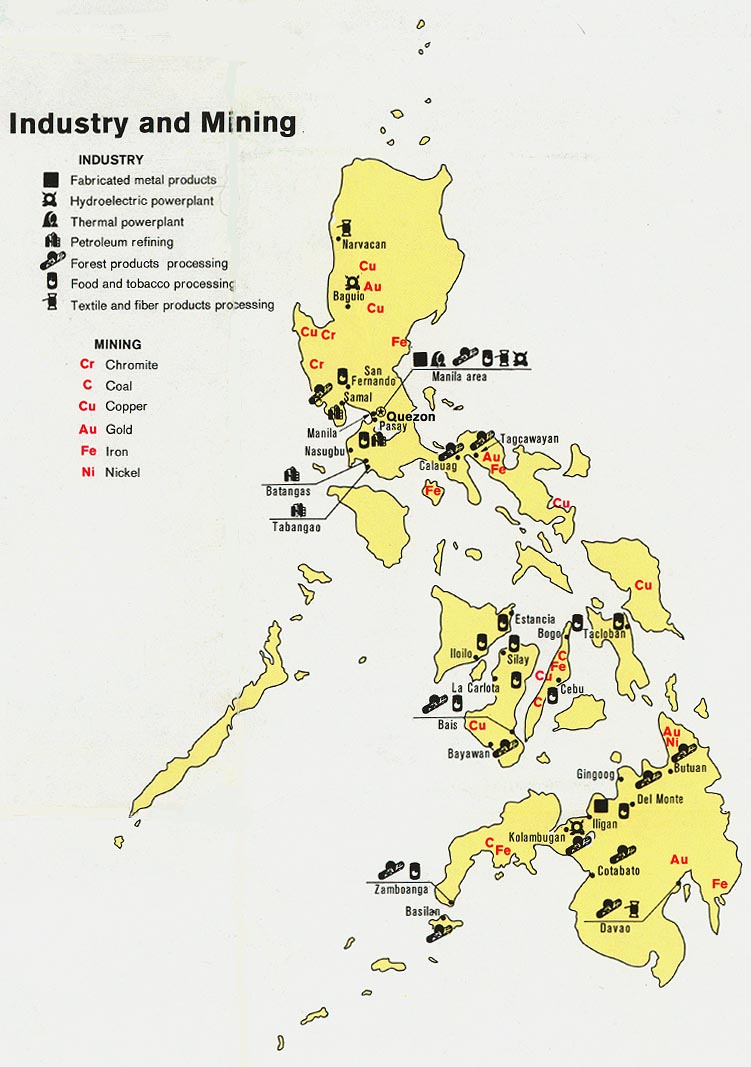
Philippines - Industry and Mining from Map No. 501475 1973 (137K)
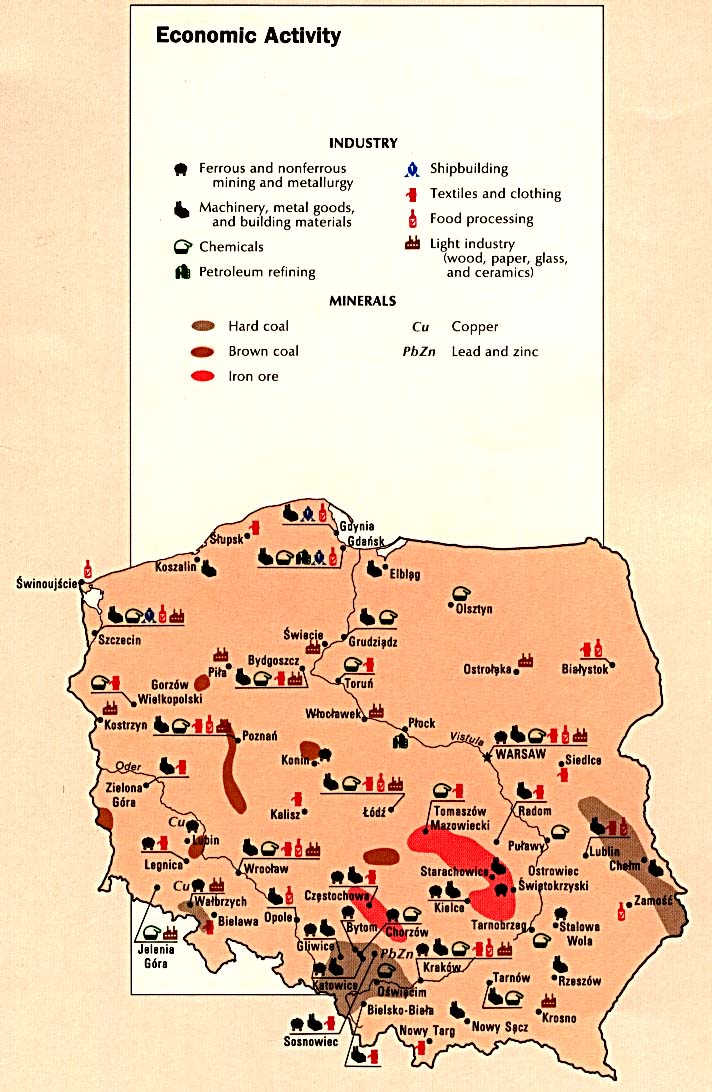
Poland - Economic Activity from the CIA Atlas of Eastern Europe 1990 (141K)
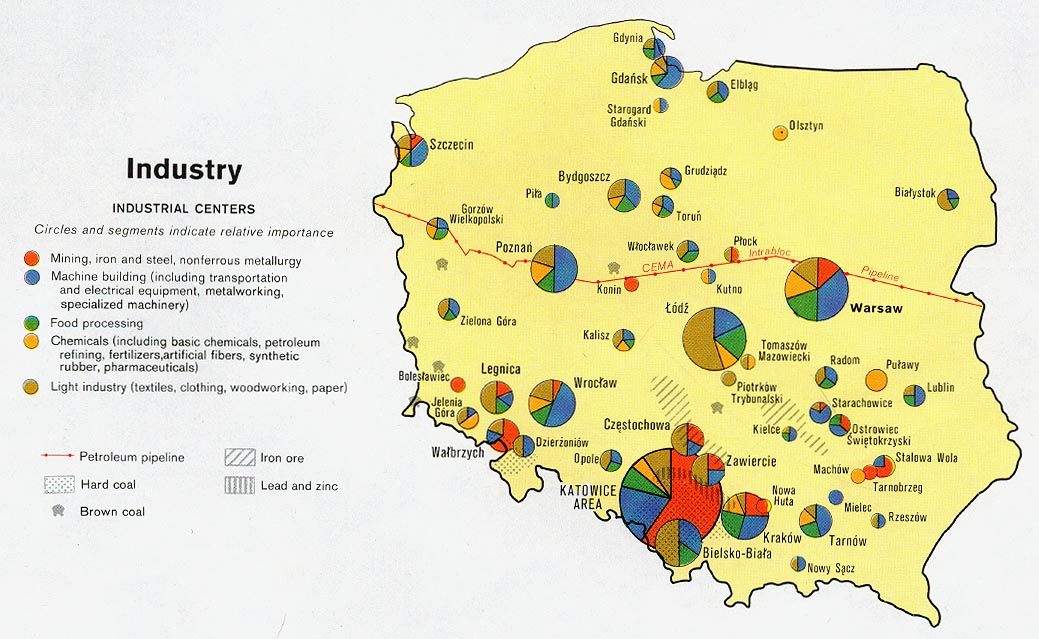
Poland - Industry from Map No. 503478 1977 (160K)
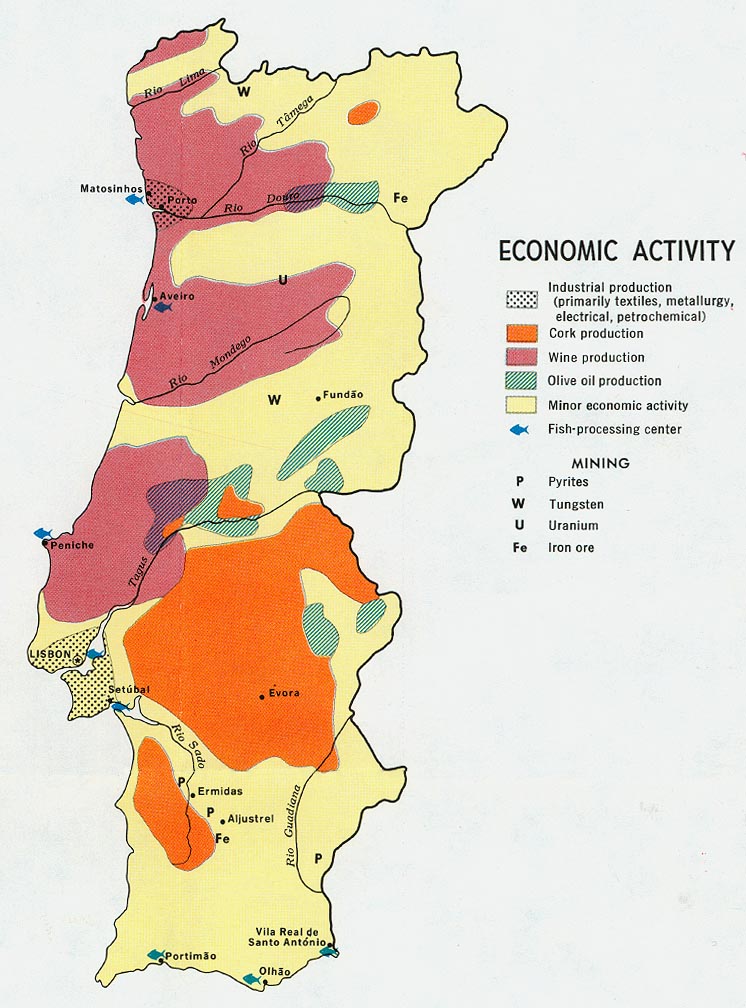
Portugal - Economic Activity from Map No. 500530 1972 (156K)
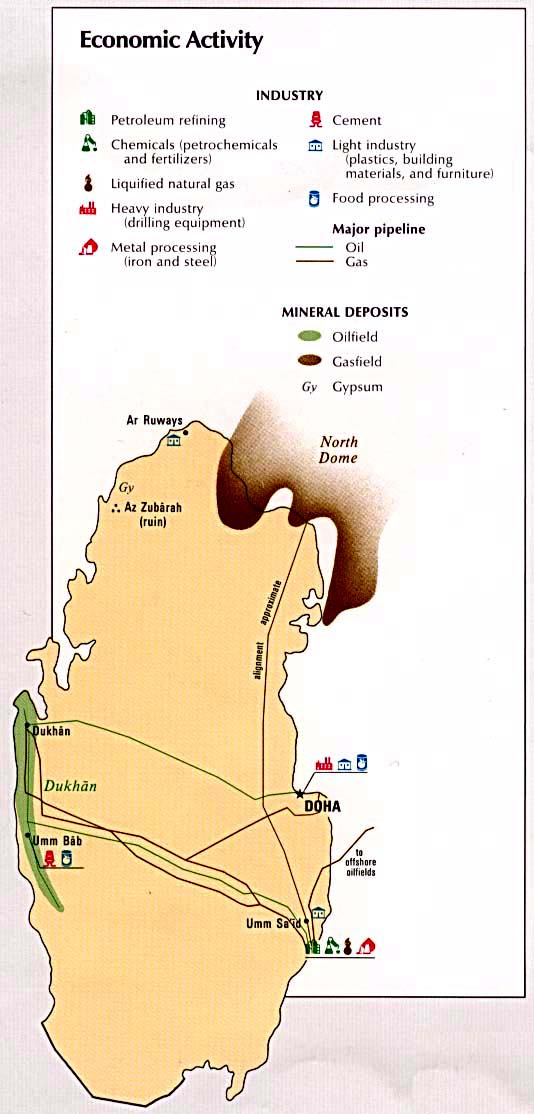
Qatar - Economic Activity from the CIA Atlas of the Middle East 1993 (76K)
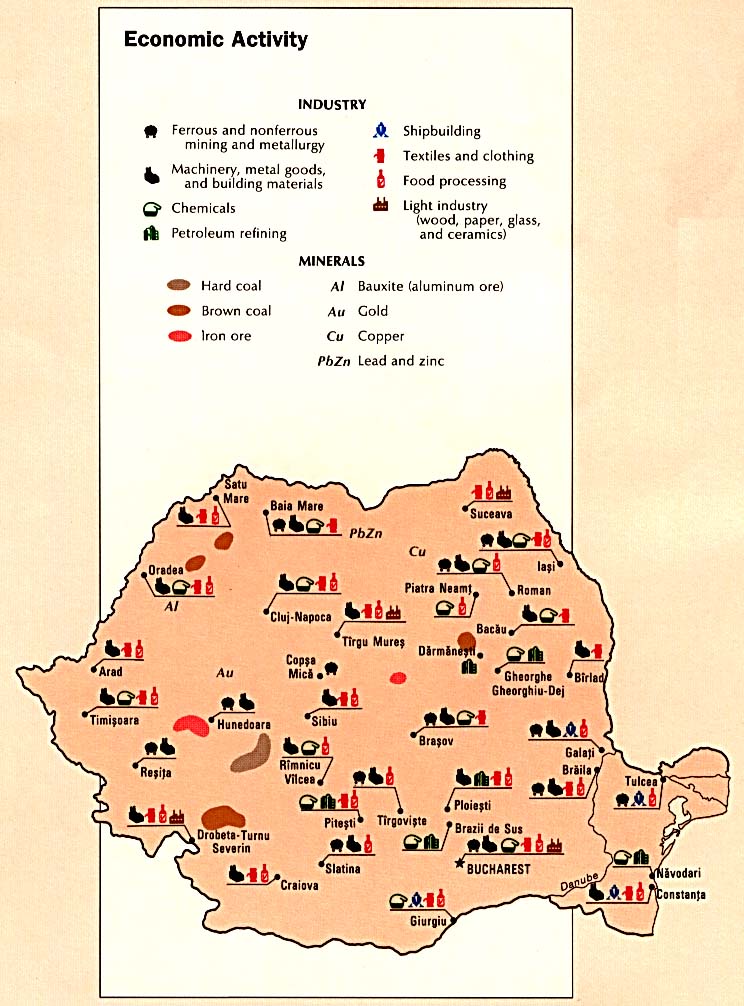
Romania - Economic Activity from the CIA Atlas of Eastern Europe 1990 (127K)
Romania - Industrial Centers from Map No. 76858 1970 (172K)
[Russia] Soviet Union - Machine Building and Metal Working from Map No. 501614 1974 (154K)
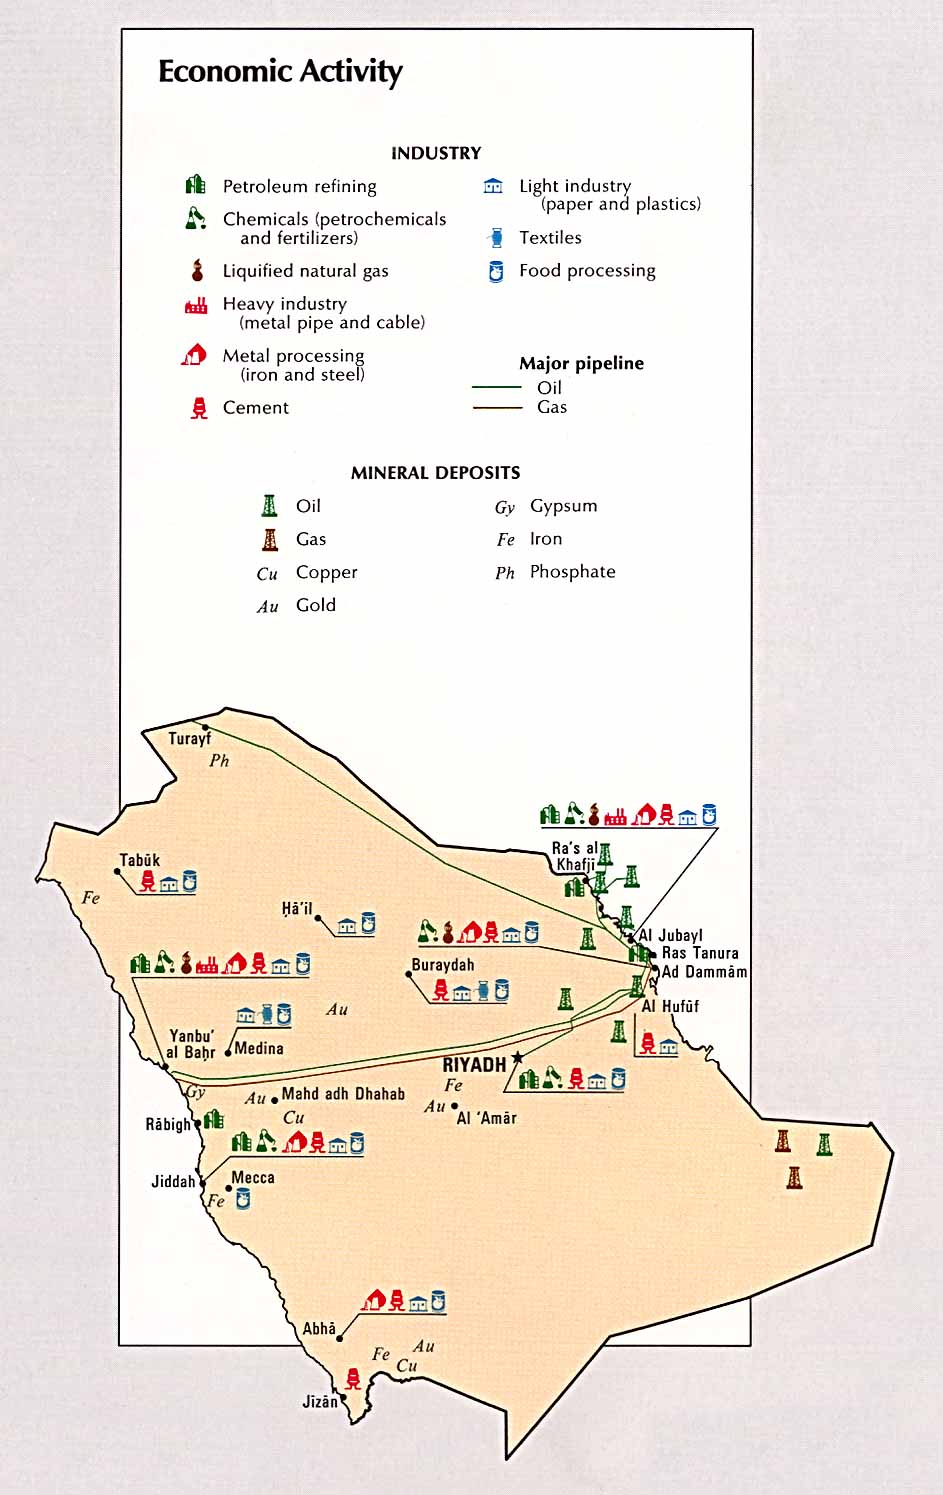
Saudi Arabia - Economic Activity from the CIA Atlas of the Middle East 1993 (120K)
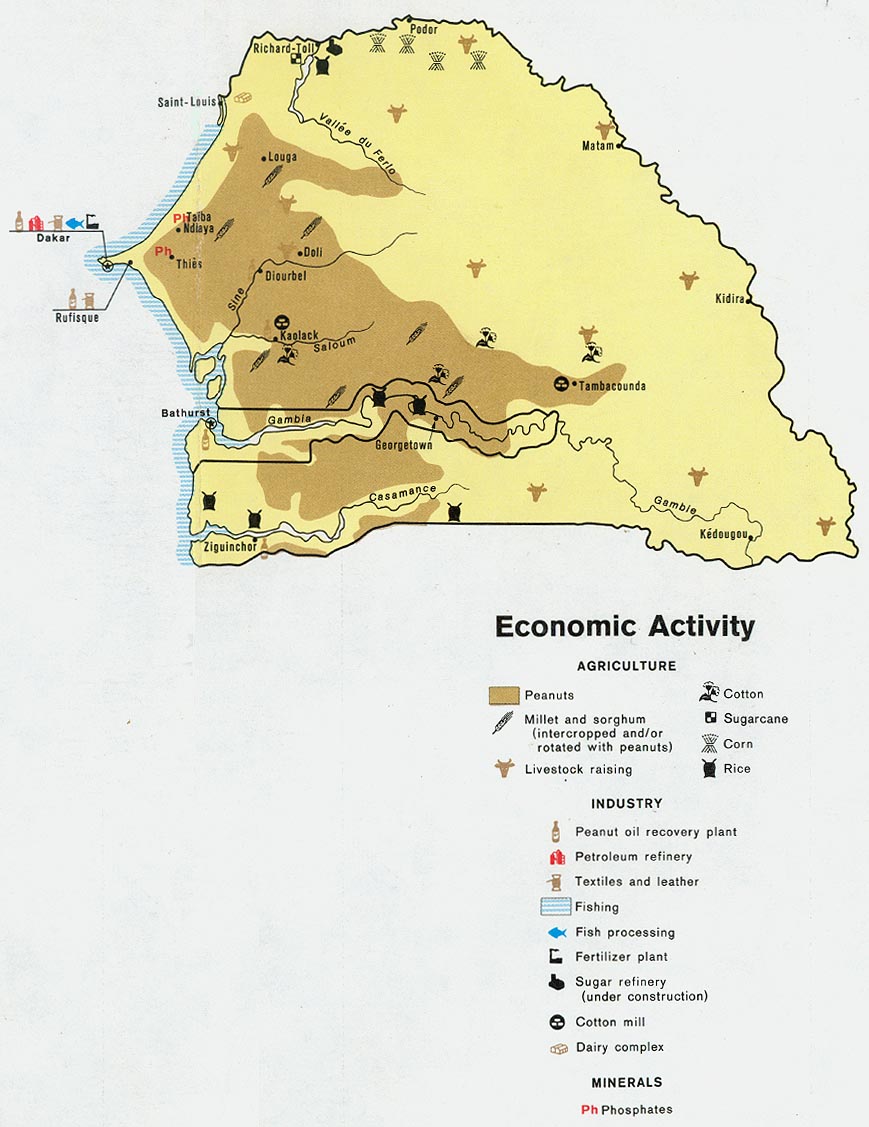
Senegal and Gambia - Evonomic Activity from Map No. 500708 1972 (148K)
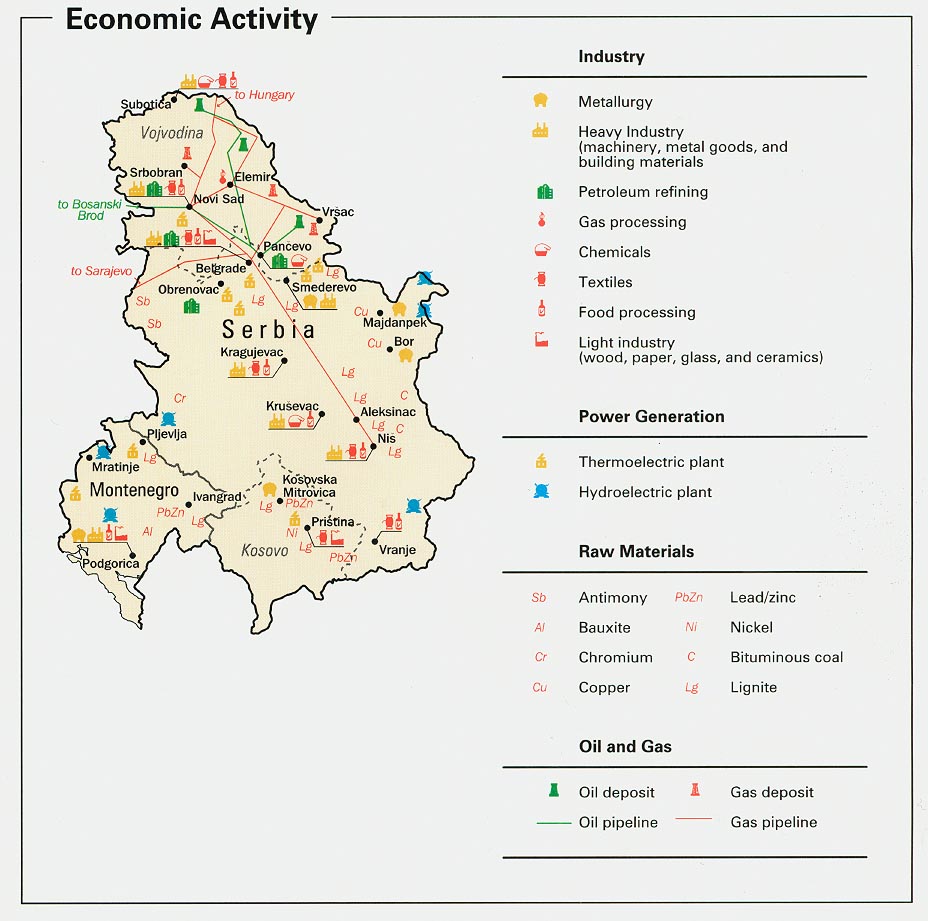
Serbia and Montenegro - Economic Activity from Map No. 802165 1993 (154K)
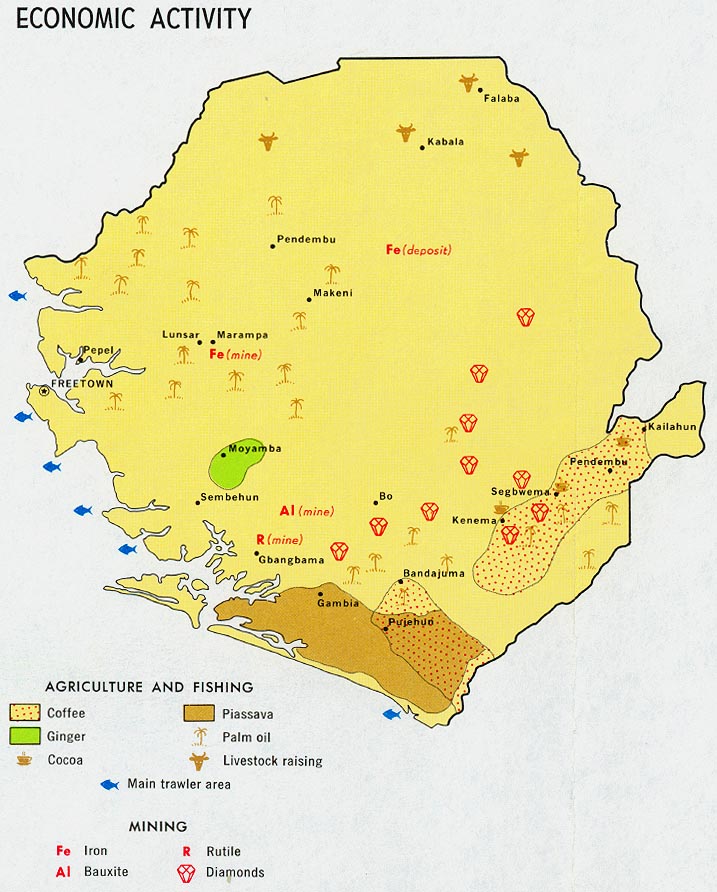
Sierra Leone - Economic Activity from Map No. 58962 1969 (137K)
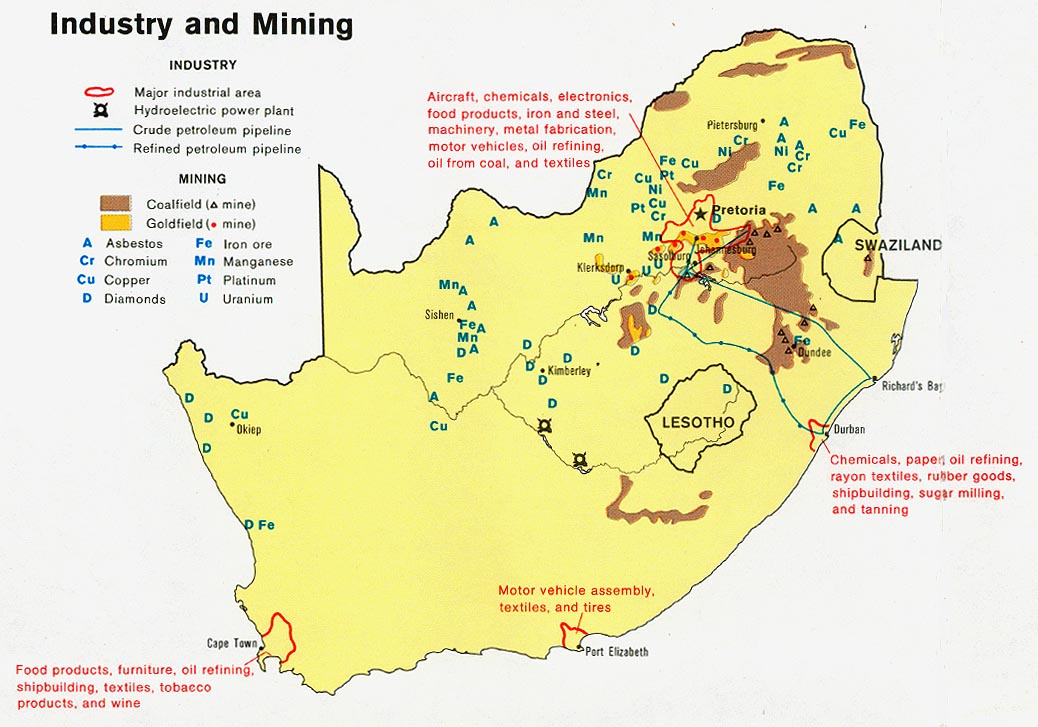
South Africa - Industry and Mining from Map No. 503971 1979 (149K)
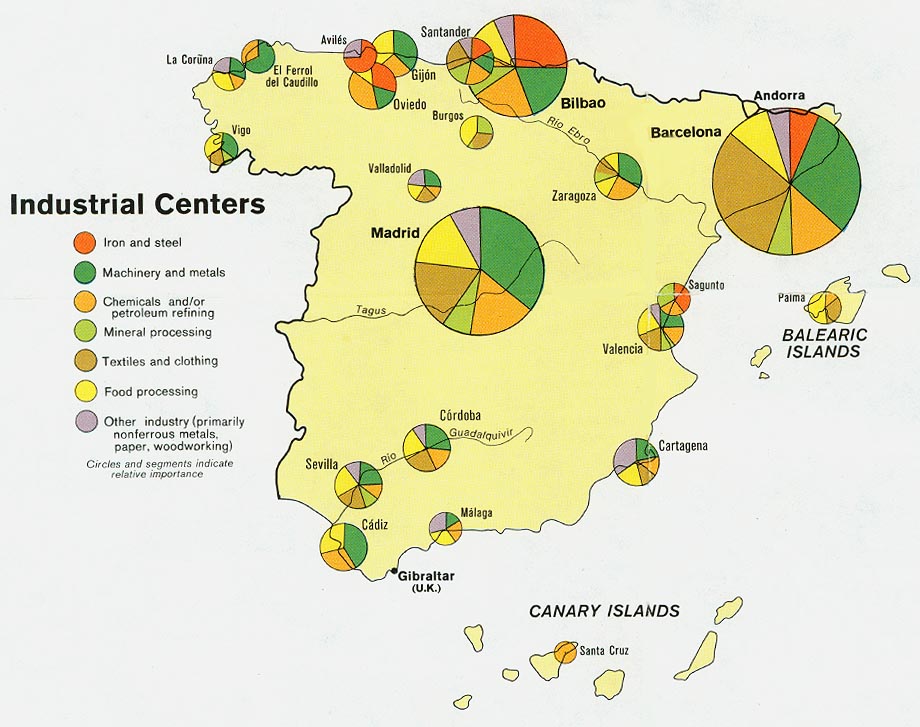
Spain - Industrial Centers from Map No. 501745 1974 (134K)
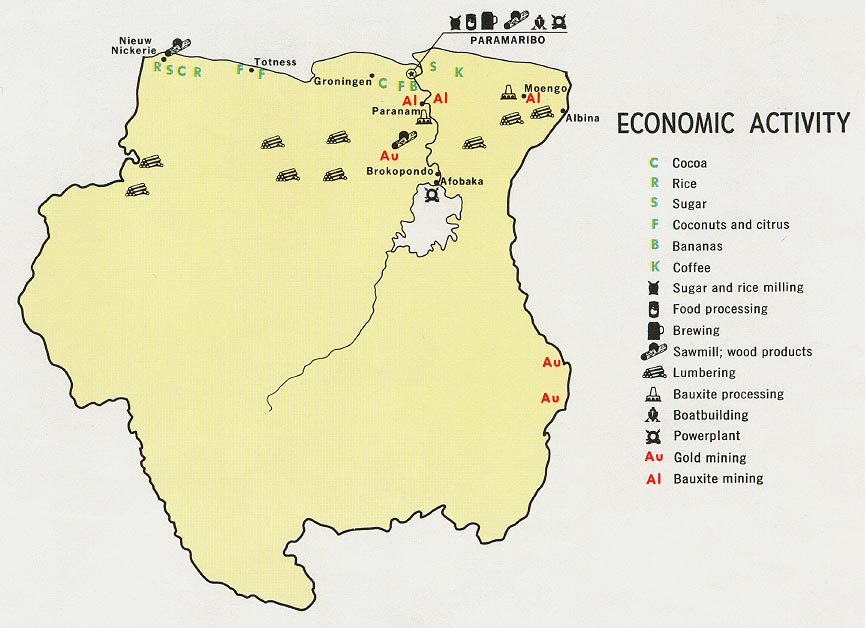
Suriname - Economic Activity from Map No. 56828 1968 (98K)
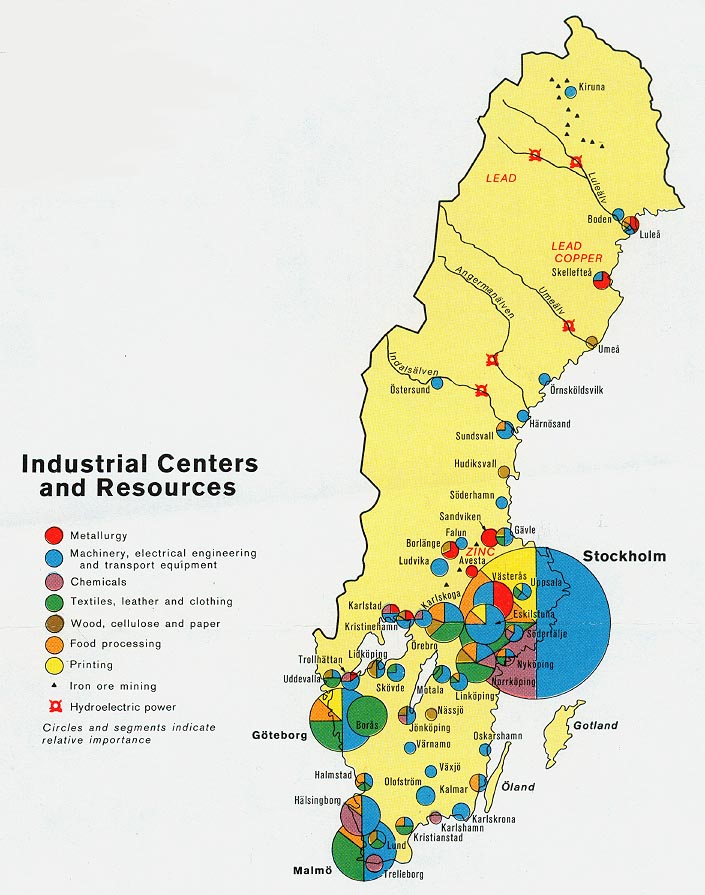
Sweden - Industrial Centers from Map No. 500866 1973 (137K)
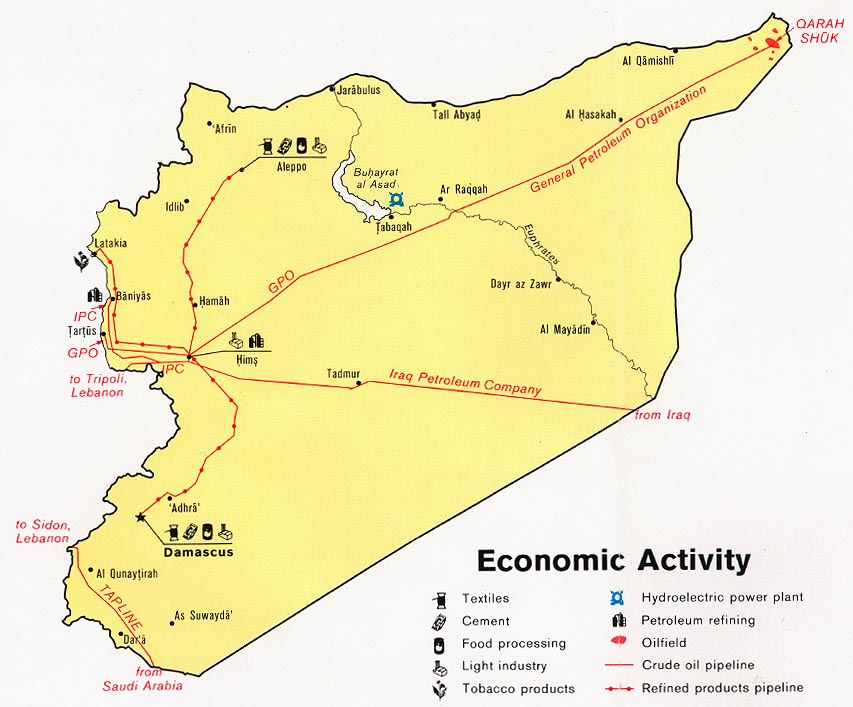
Syria - Economic Activity from the CIA Atlas of the Middle East 1993 (103K)
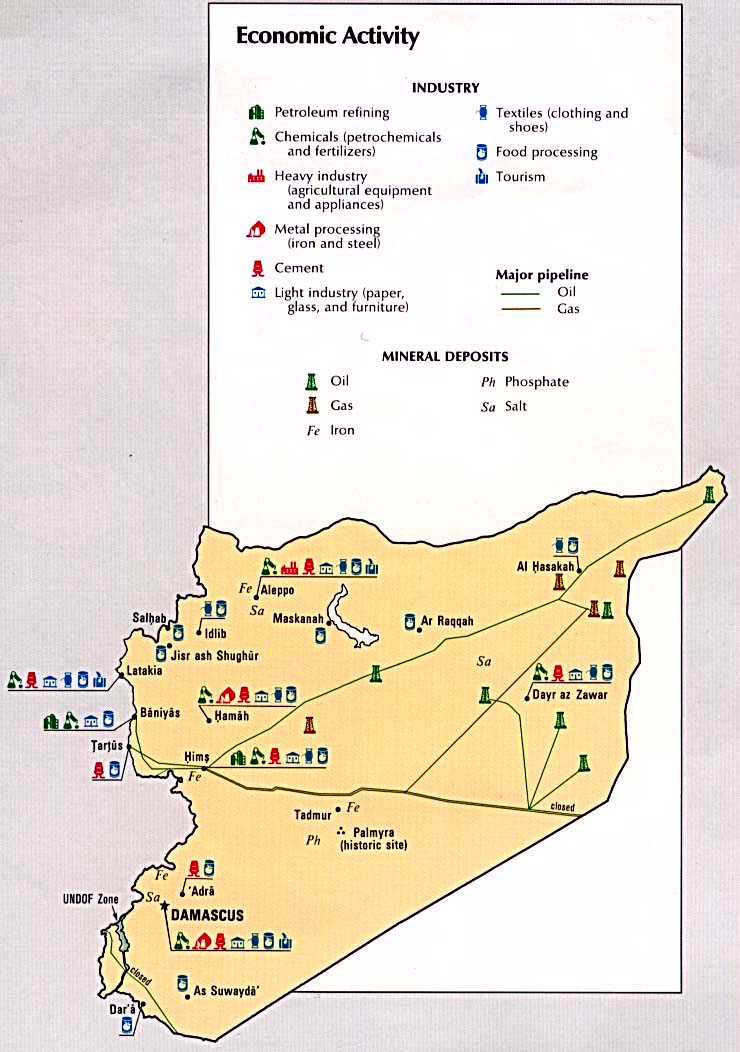
Syria - Economic Activity from Map No. 503966 1979 (115K)
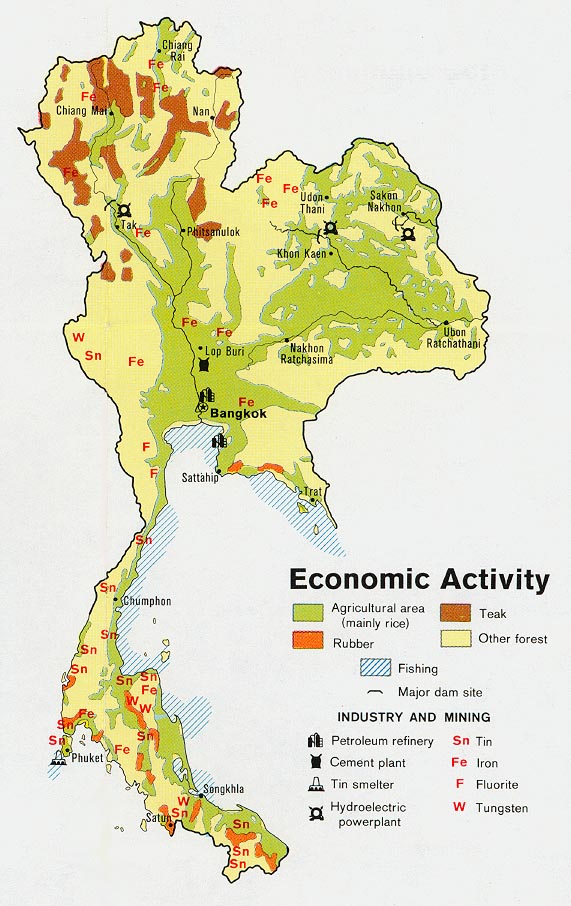
Thailand - Economic Activity from Map No. 501551 1974 (134K)
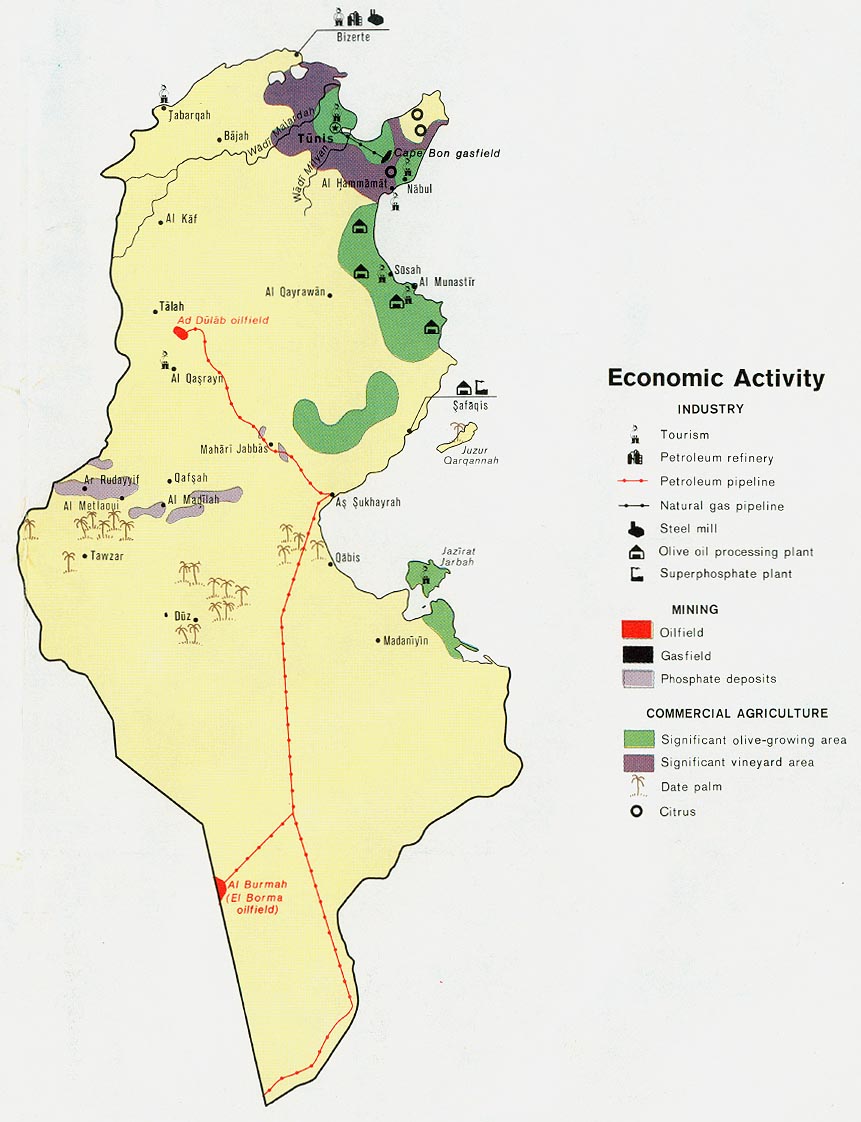
Tunisia - Economic Activity from Map No. 500587 1972 (134K)
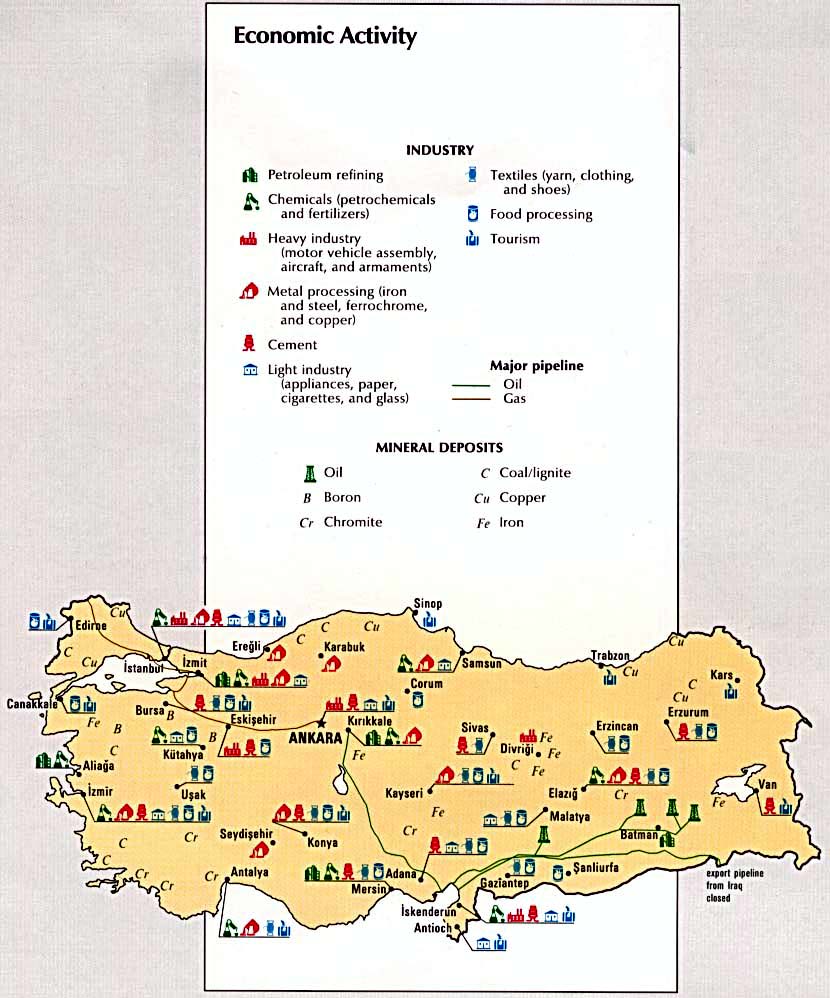
Turkey - Economic Activity from the CIA Atlas of the Middle East 1993 (126K)
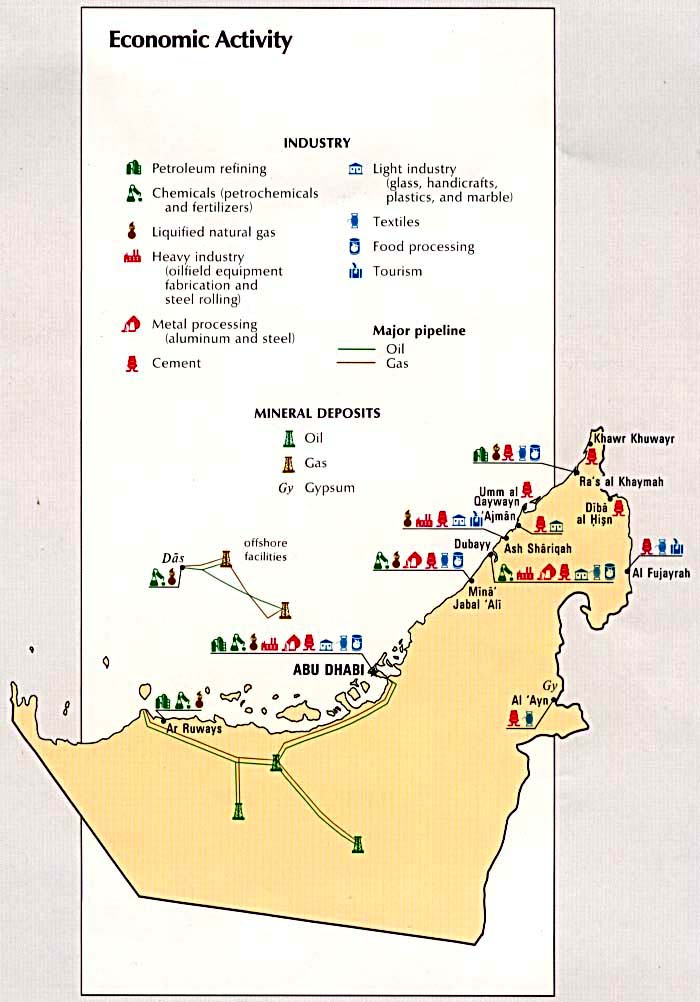
United Arab Emirates - Economic Activity from the CIA Atlas of the Middle East 1993 (87K)
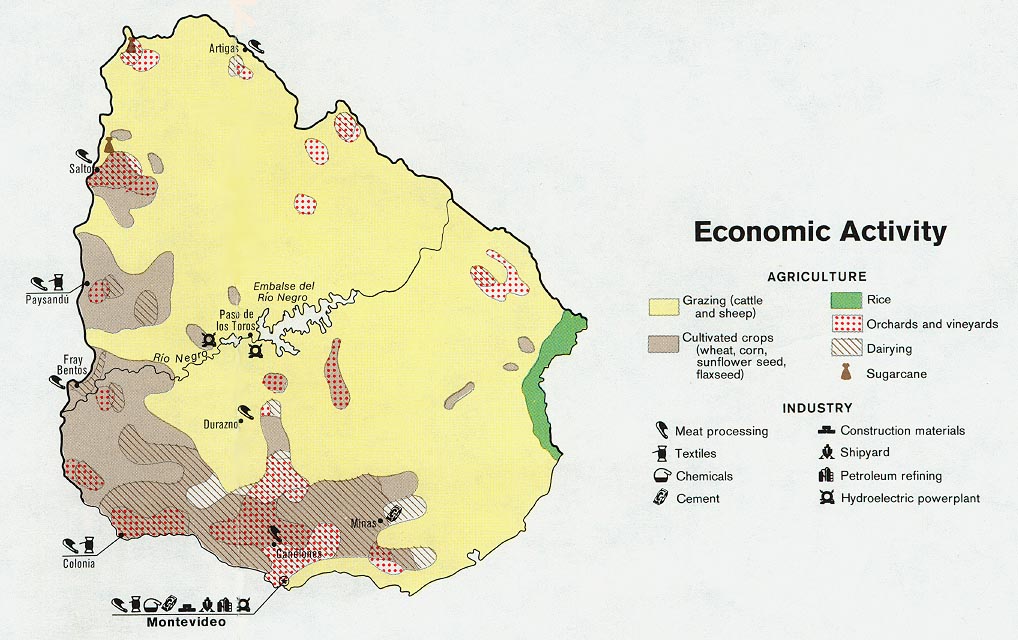
Uruguay - Economic Activity 1974 (140K)
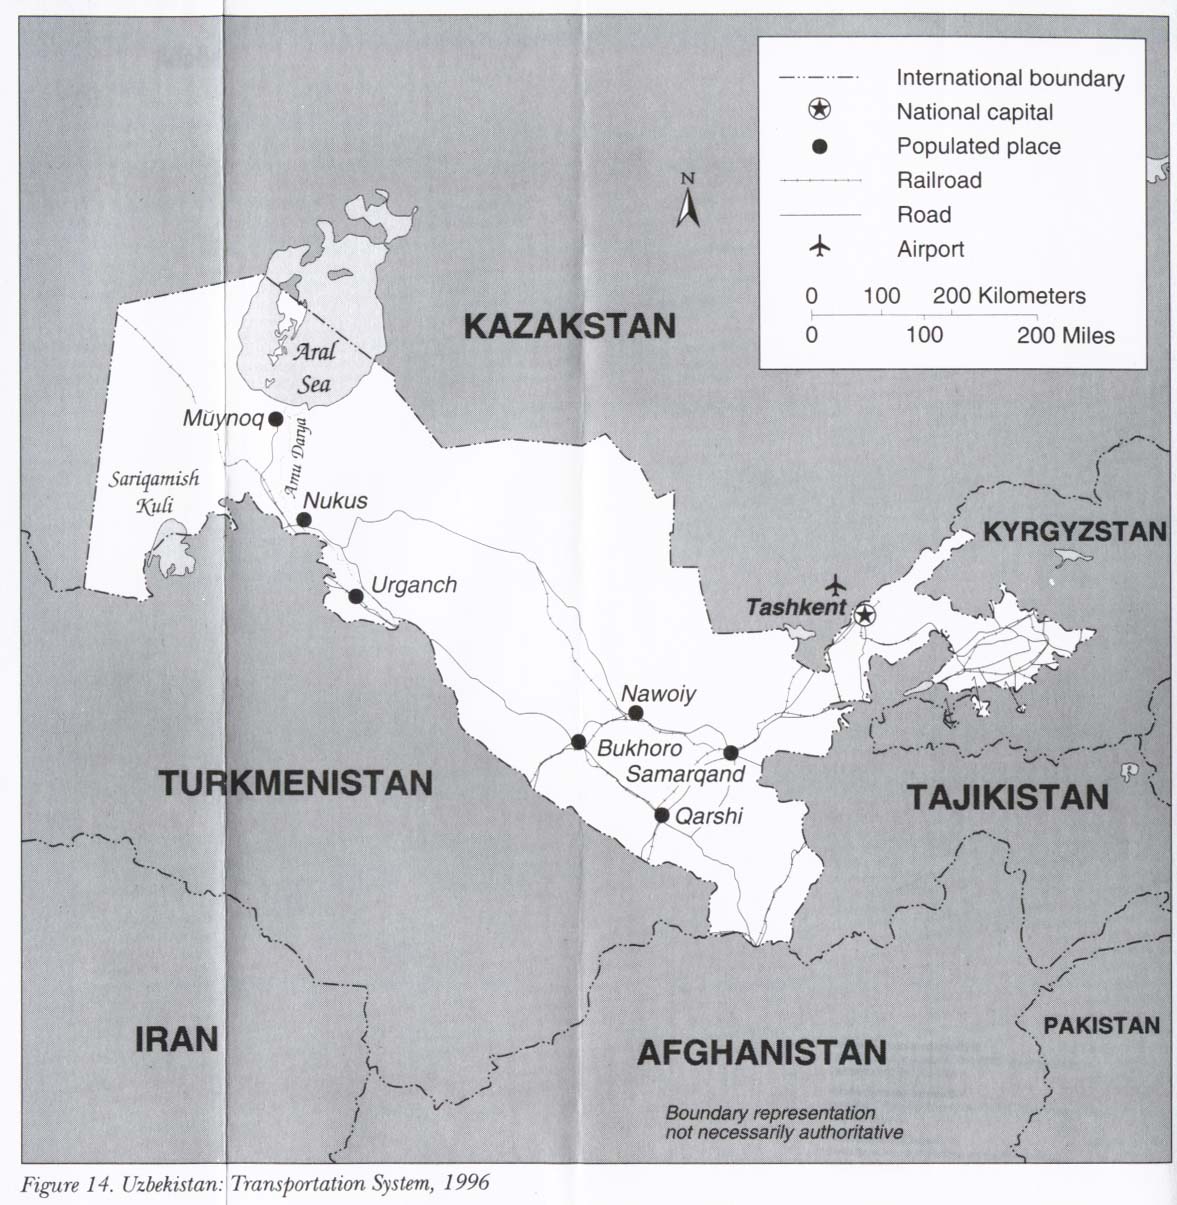
Uzbekistan - Transportation System 1996 from Kazakstan, Kyrgyzstan, Tajikistan, Turkmenistan, and Uzbekistan: Country Studies. 1997 (150K)
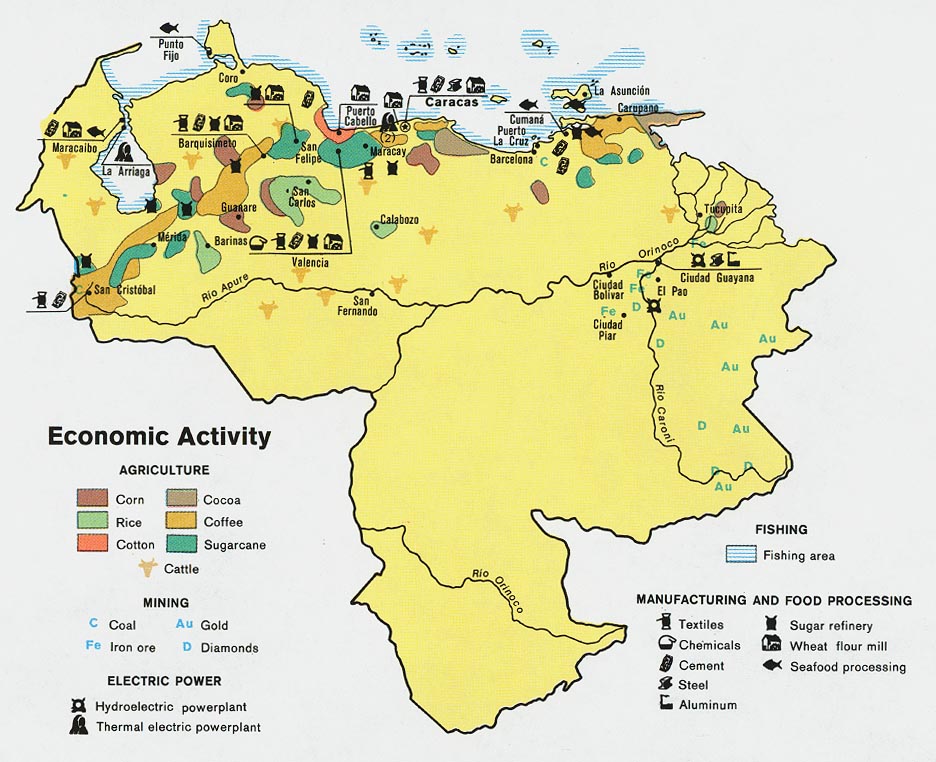
Venezuela - Economic Activity from Map No. 500516 1972 (158K)
Vietnam [South] - Economic Activity from Map No. 500874 1972 (140K)
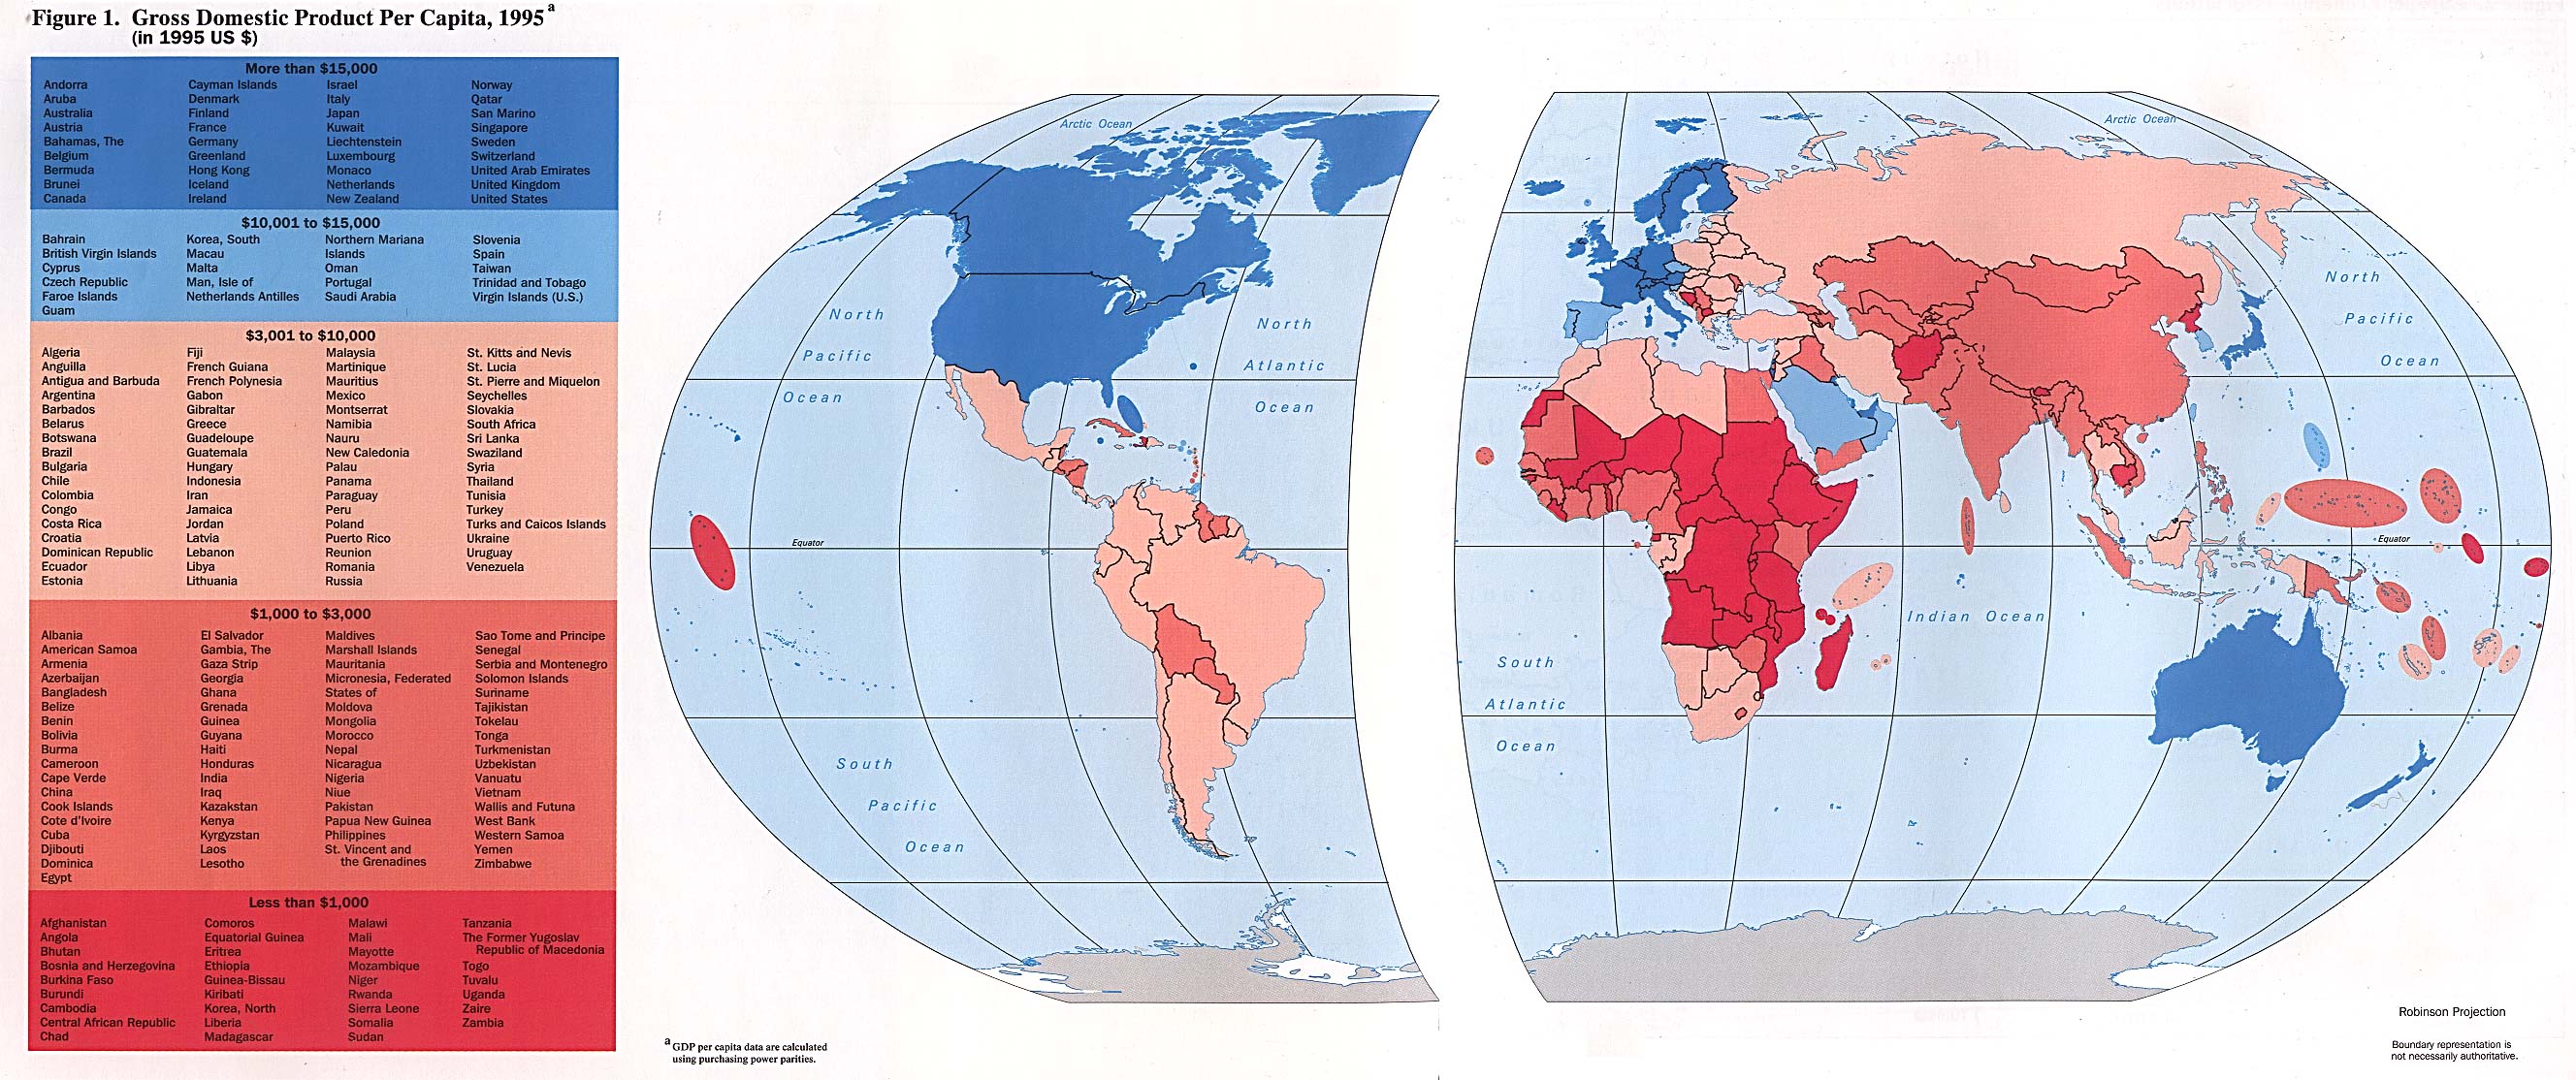
World - Gross Domestic Product Per Capita from Handbook of International Economic Statistics. 1996 (546K)
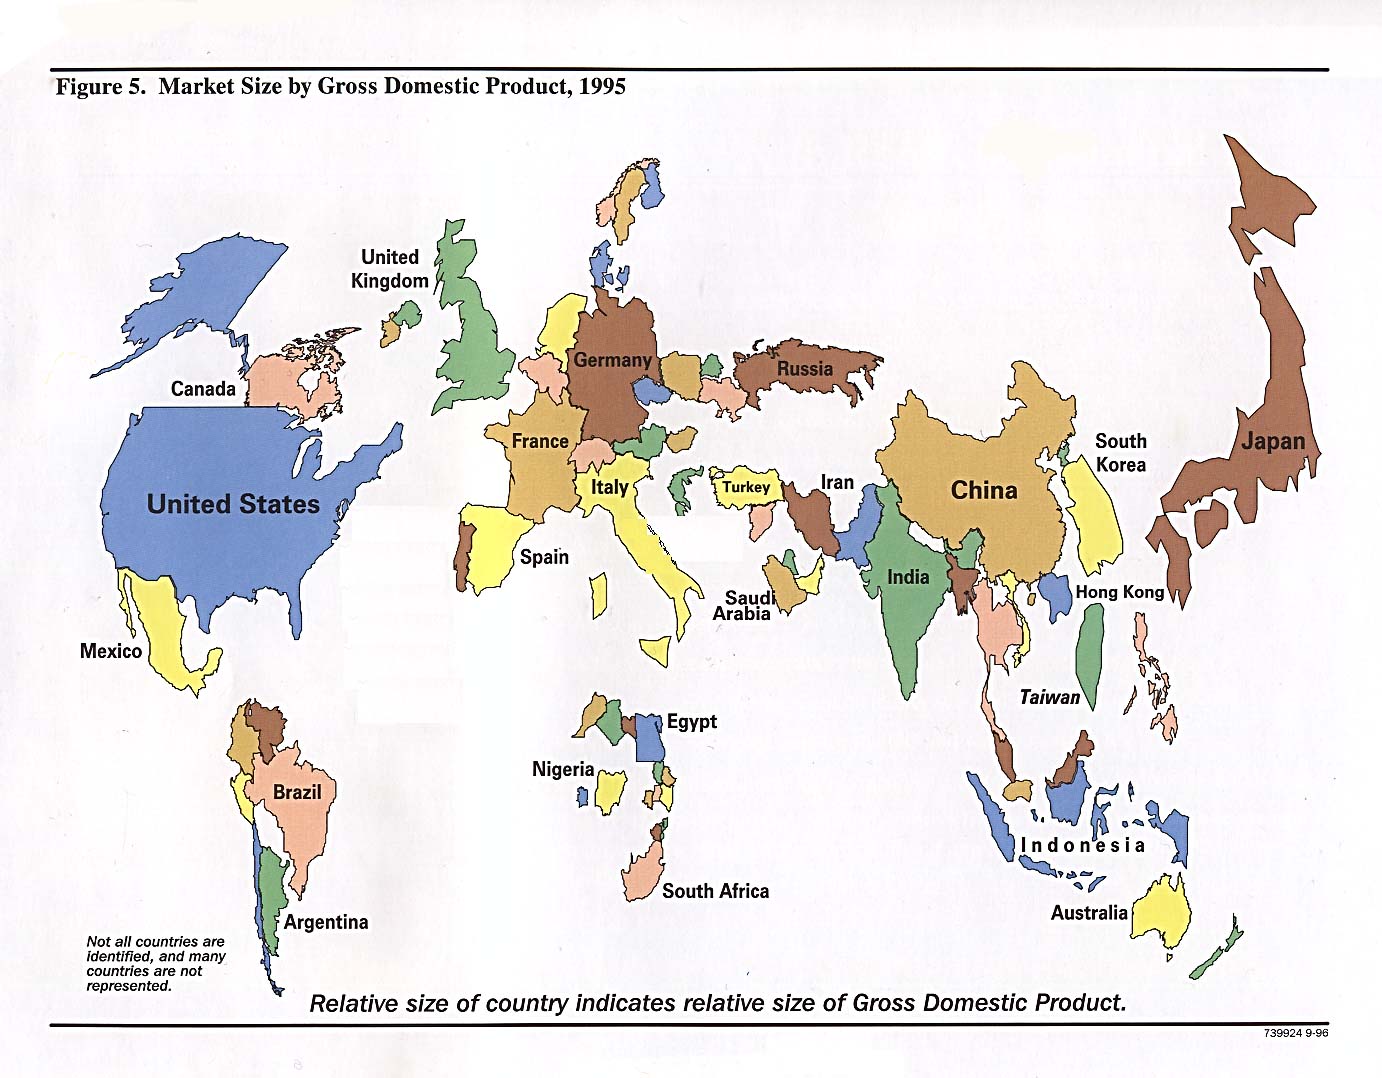
World - Market Size By Gross Domestic Product from Handbook of International Economic Statistics. 1996 (215K)
World - Vulnerable Single-Commoditiy-Dependent Economies from Handbook of International Economic Statistics 1996 (390K)
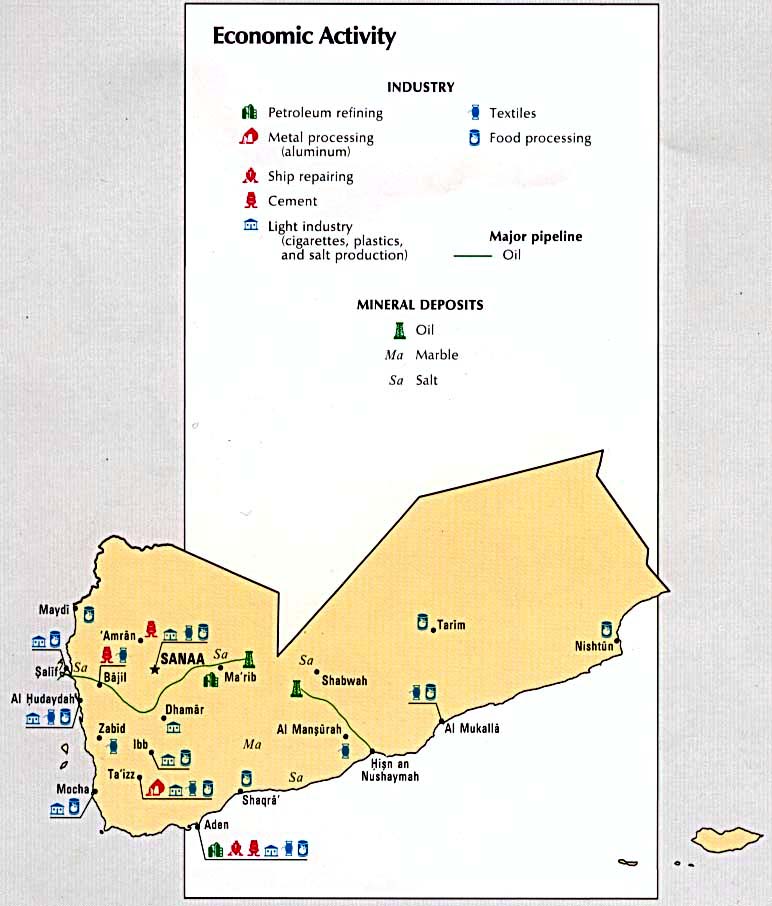
Yemen - Economic Activity from the CIA Atlas of the Middle East 1993 (81K)
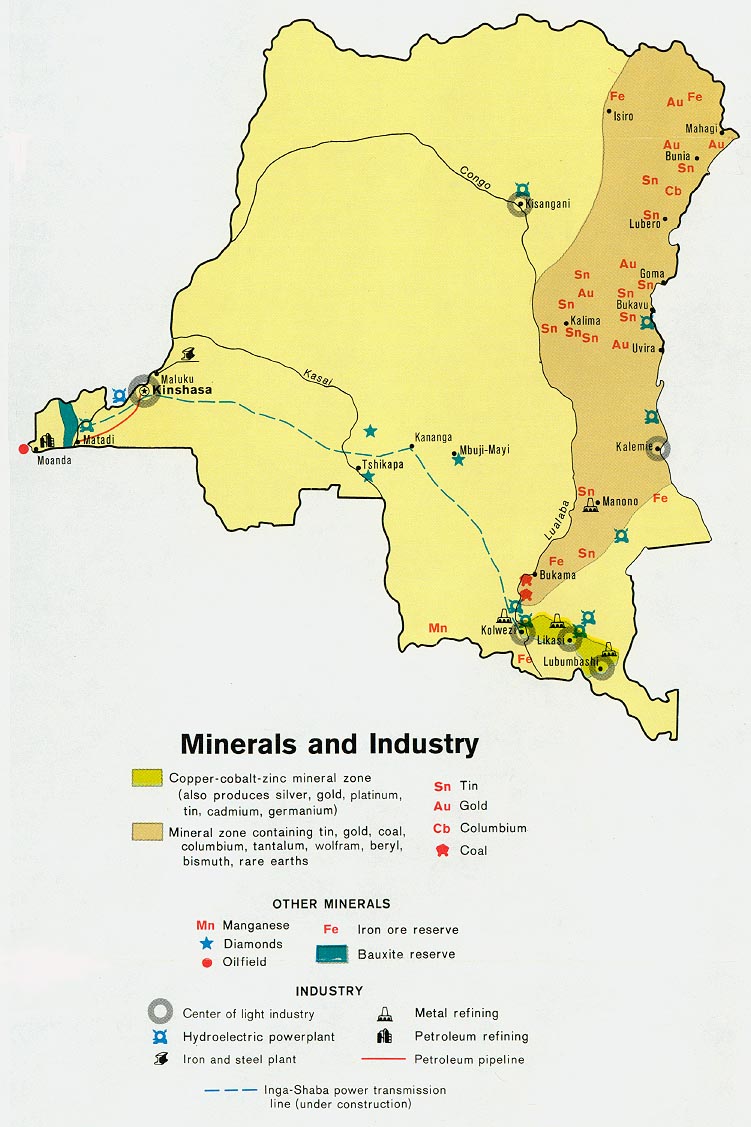
Zaire - Minerals and Industry from Map No. 504165 1979 (141K)
[Zimbabwe] Rhodesia - Economic Activity from Map No. 543857 1979 (174K)
Sources: These maps were provided by the University of Texas Library and/or
the U.S. Central Intelligence Agency (CIA) unless otherwise noted.
<-- Free Map Downloads
<-- World Country Map Downloads
<-- World Thematic Map Downloads
Didn't find what you are looking for? We've been online since 1996 and have created 1000's of pages. Search below and you may find just what you are looking for.
Michael R. Meuser
Data Research & GIS Specialist
MapCruzin.com is an independent firm
specializing in GIS project development and data research.
We created the first U.S. based
interactive toxic chemical facility
maps on the internet in 1996 and we
have been online ever since. Learn more about us and our services.
Have a project in mind? If you have data, GIS project or custom shapefile needs contact Mike.
Contact Us
Report Broken Links
Subscribe for Updates


![[Burkina Faso] Upper Volta - Economic Activity](/free-maps-thematic/upper_volta_econ_1968.jpg)
![[Czech and Slovak Republics] Czechoslovakia - Economic Activity](/free-maps-thematic/czech-economy.jpg)
![[Czech and Slovak Republics] Czechoslovakia - Industries](/free-maps-thematic/czechoslovakia_industry_1974.jpg)
![Korea [North] - Economic Activity](/free-maps-thematic/north_korea_econ_1972.jpg)
![Korea [South] - Economic Activity](/free-maps-thematic/south_korea_econ_1973.jpg)
![[Russia] Soviet Union - Machine Building and Metal Working](/free-maps-thematic/ussr_machine_1974.jpg)
![Vietnam [South] - Economic Activity](/free-maps-thematic/south_vietnam_econ_1972.jpg)
![[Zimbabwe] Rhodesia - Economic Activity](/free-maps-thematic/south_rhodesia_econ_1979.jpg)