Air Quality Has Improved, but Challenges Remain
Why Is This Important?
Life is dependent on air. Each one of us breathes about 3,400 gallons of air every day. Yet, daily our air is contaminated by human activities such as driving cars, burning fossil fuels, using chemicals, etc.
The number of days Silicon Valley air exceeds ozone and particulate matter standards are indicators of air contamination. Ground-level ozone is the main component of smog and is created when volatile organic compounds (VOCs) mix with nitrogen oxides in the presence of sunlight -- especially on hot, summer days. Vehicles are the primary source of VOCs and nitrogen oxides. Fine particulate matter (PM10) -- dust, smoke, and soot -- is generated primarily from roads, grading, and construction. Other sources of PM10 include vehicles, parking lots, woodburning, and industrial and agricultural processes.

How Are We Doing?
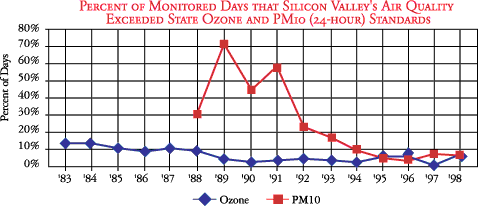
Overall, Silicon Valley's air quality has improved notably since the 1980s. However, we must guard against recent increases in bad air days.
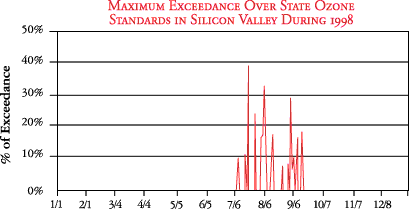
Silicon Valley exceeded the state standard for ozone 23 days in 1998, up from just four days in 1997. The federal standard was exceeded three days in 1998, up from zero days in 1997. All exceedances of the state ozone standard in 1998 occurred during July through September, when the weather was hot and still. The exceedances ranged from about 6% to 40% above the standard, with an average exceedance of 16%. 1997 was an unusually clean year because El Nino brought strong winds before the rainy season. The weather during the 1998 ozone season was more typical for the region.
Data Source: Bay Area Air Quality Management District
In addition to ozone, which exceeded state standards about 6% of days in 1998, Silicon Valley exceeded the state standard for particulate matter (PM10) about 7% of days monitored. Health consequences associated with particulate matter are more severe than ozone. The standards for carbon monoxide have not been exceeded in Silicon Valley since 1991, while nitrogen dioxide and sulfur dioxide standards have not been violated since the 1970s.
Improving air quality will require alternatives to conventional modes of transportation, improved technology, and different commuting behavior.
Why Is This Important?
Reliance on automobiles also encourages low-density land use patterns, leading to urban sprawl. Auto infrastructure uses about 33-50% of land in a
typical American city. Further, traffic congestion causes costly delays which translate into lost productivity, wasted gas, and stress.
How Are We Doing?
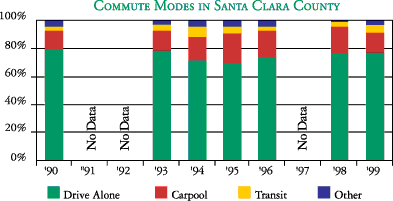
After trending downward slightly from 1990 to 1995, more Santa Clara County residents have resumed driving to work alone (76.7% commuted alone in 1999 compared to 70.5% in 1995). It is possible that this increase in solo driving resulted from the discontinuation of Regulation 13 (Rule 1) in January 1996 requiring employers to implement trip reduction programs.
Carpooling peaked in 1995 at about 21%, dropping to 15% in 1999.
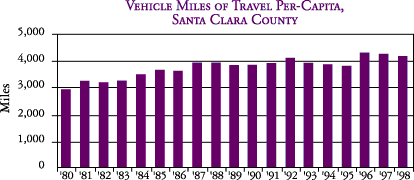
The total vehicle miles of travel in Santa Clara County has increased dramatically over the past two decades, jumping 85% from 3.8 million miles in 1979 to 7.0 million miles in 1997. About one-third of this increase is due to increases in the County's population, while the remaining two-thirds is caused by increases in vehicle miles traveled
per person.
Why Is This Important?
With only 4% of the world's population, the United States accounts for a quarter of all energy-related carbon emissions worldwide. In 1997 more than 2,500 economists -- including 8 Nobel Laureates -- endorsed a statement saying that for the United States in particular, sound economic analysis shows that there are policy options that would slow climate change without harming American living standards, and these measures may in fact improve U.S. productivity in the longer run.
How Are We Doing?
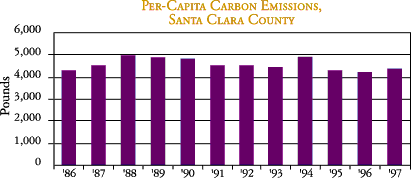
Since per-capita carbon emissions in recent years have been approximately equivalent to a decade ago, the increase in total carbon emissions is likely attributable to population growth and an increase in vehicle miles traveled per person.
To allow the earth's climate to return to equilibrium over the next few centuries, man-made carbon emissions must be reduced to the rate at which the oceans and forests can absorb them -- as much as 80% below today's rate.
The success of the Montreal Protocol, the historic international treaty to curb ozone layer depletion, serves as a model to solve other global high-risk threats, such as global climate change.
Ozone gas high in the atmosphere plays a key role in shielding people, animals, and plants from dangerous forms of ultraviolet radiation. Releases of chlorofluorocarbons (CFCs) and other ozone-depleting gases over the past 25 years have thinned the earth's stratospheric ozone layer, causing a hole twice the size of Europe. As a result, more ultraviolet radiation is reaching the earth's surface. This, in turn, is believed to increase the incidence of skin cancer, cataracts, and impaired immune systems, and is expected to reduce crop yields, diminish the productivity of the oceans, and possibly to contribute to the decline of amphibious populations that is occurring around the world.
In response to this threat, many governments worldwide united to sign the Montreal Protocol in 1987, requiring the phase-out of ozone-depleting chemicals by predetermined time frames. It appears to be working. The build-up of ozone-depleting compounds in the lower part of the atmosphere has finally leveled off and is now declining. The ozone shield is expected to recover, returning to 1980 levels in a half century or more if continued vigilance is exercised and illegal trade is restrained.
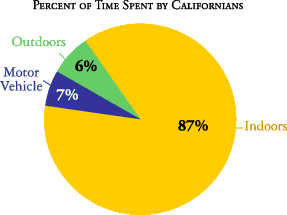
Californians spend 87% of their time indoors, 7% in a motor vehicle, and only 6% outdoors. Despite the small amount of time spent outdoors, air pollution control programs emphasize outdoor air quality, paying relatively less attention to indoor air pollution. Yet the same air pollutants covered by environmental laws outside are usually found at much higher levels in the average American residence.
In our homes and offices a variety of toxic pollutants such as volatile organic compounds evaporate from sources such as paint, dry cleaned clothes, solvents, certain cleaners, air fresheners, wallboard, adhesives, furniture stains, perfumes, electronic machines, and other sources. While each chemical might be harmless on its own, they can mix and react with one another to become much more powerful.
The use of hazardous chemicals in the high technology industry is of particular concern due to the potential for exposures to Silicon Valley workers. For example, hundreds of chemicals are used in making semiconductors, some of them known or suspected carcinogens (cancer-causing). While the high technology industry generally rejects any link between working conditions and adverse health problems, some employees who have contracted cancer or suffered other medical problems have brought lawsuits against leading high-tech companies.
Far more research is needed to determine the quality of indoor air in Silicon Valley's work sites and homes. To protect public health, environmental laws should aim to reduce people's exposure to toxic pollutants. In the meantime, precautions are warranted including reducing and eliminating the use of hazardous chemicals in industry and common consumer products, conducting indoor air monitoring and personal monitoring, enacting protective measures and safety controls, providing education and proper warnings to workers and consumers, and taking simple measures such as removing one's shoes or wiping one's feet on a doormat before entering a home.
Website developed by Clary Meuser Research Associates
![]()
Ride-Sharing Helping, But Heavy Dependence on Car Continues
Transportation was rated the number one concern by the Bay Area's populace in a 1998 poll by the Bay Area Council. And it's no wonder given the impacts transportation has on the environment, economy, and quality of life. Transportation accounts for more than half of our air pollution and carbon emissions, and contributes to water pollution due to the wearing of brake pads, vehicle emissions, and runoff from roads and parking lots.
Data Source: RIDES for Bay Area Commuters
In the years following World War II, 40% of the American work force commuted by public transit. Now only 4% of Santa Clara County's residents commute that way, with more than three-quarters driving to work alone.

Data Source: California Department of Transportation,
Transportation System Information Program
![]()
Carbon Emissions Increase 19% Since 1986 Due to Transportation
The principal man-made source of carbon emissions is the combustion of fossil fuels. These emissions are altering the chemistry of the atmosphere, threatening to change global climate. The potential impact of climate change on the economy, quality of life, and natural systems is significant. Scientific evidence suggests climate change would be detrimental to human health, ecosystems, food security, and water resources in many regions of the world.

The total carbon emissions attributable to gasoline, electricity, and natural gas use in Santa Clara County was 3.6 million tons in 1997, or 4,323 pounds per person. Since 1986 carbon emissions from these three sources have increased 19%. Almost all of this increase is from the transportation sector, which accounts for the majority of total carbon
emissions. Compared to the rest of the United States,
Santa Clara County has proportionately fewer carbon
emissions from electricity sources since much of the
Western United States' electric power is from
hydroelectric and other non-fossil sources.
Data & Conversion Factor Sources: California Energy
Commission, California Department of Transportation,
and U.S. Department of Energy.
![]()
Ozone-Depleting Compounds Phase Out as International Treaty Implemented
A Model Solution to a Global Threat

Emission Data Source: Bay Area Air Quality Management District
![]()
Indoor Air Quality Research Needed
Data Source: "Everyday Exposure to Toxic Pollutants,"
Scientific American, 2/98.
Copyright � 1999, Silicon Valley Environmental Partnership
All Rights Reserved