reimagining relationships
Home   Store   Free GIS   Education   Free Shapefiles   Census   Weather   Energy   Climate Change   News   Maps   TOPO   Aerial   GPS   Learn GIS

DOWNLOAD SHAPEFILES: Canada FSA Postal - Zip Code - U.S. Waterbodies & Wetlands - Geographic Names - School Districts - Indian Federal Lands
Zip Code/Demographics - Climate Change - U.S. Streams, Rivers & Waterways - Tornadoes - Nuclear Facilities - Dams & Risk - 2013 Toxic Release Inventory TRI

<-- Return to Do It Yourself GIS Maps

Climate Change Global Warming Shapefiles - Changes in Temperature and Precipitation from 2010 through 2099


These shapefiles are derived from those downloaded from the NCAR Community Climate System Model (CCSM) website. You are free to use these for non-profit, non-commercial, educational purposes subject to these Terms of Use. You may also download your own shapefiles direct from NCAR.

TatukGIS Viewer 19.3 mb
TatukGIS Viewer documentation 2.2 mb
ArcExplorer 2.2 13.5 mb
ArcExplorer Java 63.6 mb

These ArcGIS shapefiles work with the free ArcExplorer GIS viewer, ArcView GIS, ArcGIS, Maptitude, Mapinfo, Manifold, TatukGIS and many other commercial GIS and mapping programs and many free GIS programs as well. Each layer includes easy to follow instructions that show you how to add streets, highways, census information and much more to your maps for free. We have included national level base maps with each map archive listed below. Also, check our free GIS software and free GIS ArcGIS shapefiles pages for more information and free ArcGIS shapefiles. If you are new to GIS, check out our free Learn2Map GIS Tutorial and Atlas.

With these detailed shapefiles you can find out more about the effects of climate change from 2010 through 2099 anywhere in the United States.

IPCC 4th Assessment scenario A2 temperature and precipitation GIS shapefile map layers for the years 2010, 2020, 2030, 2040, 2050, 2060, 2070, 2080, 2090 and 2099. The data points are spaced approximately 4.5 km (2.8 miles) apart. The data covers the lower 48 United States. Each point includes data for each of the 12 months of the year, making comparisons and calculations of increases or decreases between months and decades possible.

Comparisons and Research Using the Shapefiles

Using the data one could look at things like increases or decreases in temperature and precipitation over decades for any area or region in the contiguous U.S. of interest. All sorts of interesting comparisons may result for example, higher precipitation along with lower temperatures may indicate more snowfall and less rain. An increase in temperature later in the year may indicate a flood risk as the snowpack melts. You can probably imagine all sorts of scenarios to investigate with this data.

Data Units

Temperature: The monthly figures within each year represent the air temperature in degrees in K (Kelvin). You can convert K to Farenheit using the following formula:

     F = (K - 273.15) * 9/5 + 32

or convert to Centigrade using this formula:

     C = K - 273.15

Precipitation: The monthly figures within each year represent the precipitation in mm (milimeters). You can convert mm to inches using the following conversion factor:

     1 millimeter = 0.0393700787 inch

or convert mm to cm (centimeters) using the following conversion factor:

     1 millimeter = 0.1 centimeters

About the A2 Scenario

The A2 storyline and scenario family describes a very differentiated and heterogeneous world. The underlying theme is self-reliance and preservation of local identities. Emphasis on economic, social, and cultural interactions between regions is less than in other storylines. Fertility patterns across regions converge very slowly, which results in high population growth. Economic development is uneven, the income gap between now-industrialized and developing parts of the world does not narrow, and per capita economic growth and technological change are more fragmented and slower than in other storylines. Main characteristics A2 scenario include: high population growth, medium GDP growth, high energy use, medium-high land use changes, low resource (mainly oil and gas) availability, slow pace and direction of technological change favoring regional economic development.

For more information on A2 Scenario read IPCC special report on Emissions Scenarios: Summary for policymakers or Full report. A2 Scenario Run set is represented by the five ensemble members. Climate models are an imperfect representation of the earth's climate system and climate modelers employ a technique called ensembling to capture the range of possible climate states. A climate model run ensemble consists of two or more climate model runs made with the exact same climate model, using the exact same boundary forcings, where the only difference between the runs is the initial conditions.Learn more about the IPCC scenarios.

The following files are contained within each region's zip file. Click here for a screenshot of a simple map created with one of these shapefiles.

  1. A detailed readme file can be found in "1-readme-first.txt."

  2. Frequently asked questions about the IPCC 4th Assessment can be found in "frequently-asked-questions.txt."

  3. The data disclaimer and citation information is in "disclaimer-citation.txt."

  4. Information about some of the various climate change scenarios is in "gisclimatechange-scenarios.txt."

  5. Ten point shapefiles, one each for the years 2010, 2020, 2030, 2040, 2050, 2060, 2070, 2080, 2090 and 2099, for the region you have selected. Each point contains data for each of the 12 months of the year.

These ArcGIS shapefiles work with the free ArcGIS Explorer GIS viewer, ArcView GIS, ArcGIS, Maptitude, Mapinfo, Manifold and many other commercial GIS and mapping programs and many free GIS programs as well. Each layer includes easy to follow instructions that show you how to add streets, highways, census information and much more to your maps for free. We have included national level base maps with each map archive listed below. Also, check our free GIS software and free GIS ArcGIS shapefiles pages for more information and free ArcGIS shapefiles.

No Experience Required

The shapefiles come with easy to follow instructions for downloading ArcExplorer, a free GIS map viewer. We provide step-by-step instructions so that you can easily learn to use and view the maps. For more help, take advantage of our free Learn2Map GIS Tutorial & Atlas.

Immediate Download

Click next to the map you wish and you will have immediate access to it.

Temperature

Region 1 - Connecticut, Maine, Massachusetts, New Hampshire, Rhode Island, and Vermont - Download Now.

Region 2 - New Jersey and New York - Download Now.

Region 3 - Delaware, Maryland, Pennsylvania, Virginia, West Virginia, and the District of Columbia - Download Now.

Region 4 - Alabama, Florida, Georgia, Kentucky, Mississippi, North Carolina, South Carolina, and Tennessee - Download Now.

Region 5 - Illinois, Indiana, Michigan, Minnesota, Ohio, and Wisconsin - Download Now.

Regions 1-5 - Includes regions 1 through 5 as described above - Download Now.

Region 6 - Arkansas, Louisiana, New Mexico, Oklahoma, and Texas - Download Now.

Region 7 - Iowa, Kansas, Missouri, and Nebraska - Download Now.

Region 8 - Colorado, Montana, North Dakota, South Dakota, Utah, and Wyoming - Download Now.

Region 9 - Arizona, California and Nevada - Download Now.

Region 10 - Idaho, Oregon, and Washington - Download Now.

Regions 6-10 - Includes regions 6 through 10 as described above - Download Now.

Precipitation

Region 1 - Connecticut, Maine, Massachusetts, New Hampshire, Rhode Island, and Vermont - Download Now.

Region 2 - New Jersey and New York - Download Now.

Region 3 - Delaware, Maryland, Pennsylvania, Virginia, West Virginia, and the District of Columbia - Download Now.

Region 4 - Alabama, Florida, Georgia, Kentucky, Mississippi, North Carolina, South Carolina, and Tennessee - Download Now.

Region 5 - Illinois, Indiana, Michigan, Minnesota, Ohio, and Wisconsin - Download Now.

Regions 1-5 - Includes regions 1 through 5 as described above - Download Now.

Region 6 - Arkansas, Louisiana, New Mexico, Oklahoma, and Texas - Download Now.

Region 7 - Iowa, Kansas, Missouri, and Nebraska - Download Now.

Region 8 - Colorado, Montana, North Dakota, South Dakota, Utah, and Wyoming - Download Now.

Region 9 - Arizona, California and Nevada - Download Now.

Region 10 - Idaho, Oregon, and Washington - Download Now.

Regions 6-10 - Includes regions 6 through 10 as described above - Download Now.

Additional Map Layers Included

Each of the GIS map archives on this page also include the following national base map layers:

  • Cities
  • Roads
  • Rivers
  • States
  • Water Bodies

A Note About How Your GIS Maps Will Look

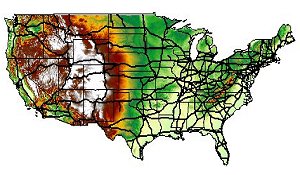
The image(s) on this page are examples of how these shapefiles may look when loaded into a GIS program. Your GIS maps may not look exactly like this. Each GIS program is different. Shapefiles themselves are a collection of points, lines or polygons. They have no attributes. It is up to you, the user, to define colors, line width, symbols and other attributes within the limits and capabilities of the GIS programs you are using.

About Quality, Accuracy and Suitability

The geodata and shapefiles found at MapCruzin.com may come from a variety of government, non-governmental and self-reporting private sources. While we try to assure the accuracy of this material, we cannot promise that it is absolutely accurate. We do promise that using the map layer will be fun, entertaining or educational - possibly even frustrating. Beyond this, we make no guarantee as to its suitability for any purpose. We assume no liability or responsibility for errors or inaccuracies. Please understand that you download and use these map layers and data at your own risk.

Please Note:

You may download various climate change shapefiles from GISclimatechange.org yourself. Mapcruzin has downloaded various shapefiles and reconfigured them here for your use. We are charging a nominal fee for delivery of these shapefiles to you.

Thank You,

<-- Return to Do It Yourself GIS Maps

Didn't find what you are looking for? We've been online since 1996 and have created 1000's of pages. Search below and you may find just what you are looking for.


Michael R. Meuser
Data Research & GIS Specialist

MapCruzin.com is an independent firm specializing in GIS project development and data research. We created the first U.S. based interactive toxic chemical facility maps on the internet in 1996 and we have been online ever since. Learn more about us and our services.

Have a project in mind? If you have data, GIS project or custom shapefile needs contact Mike.

Contact Us

Report Broken Links

Subscribe for Updates

About MapCruzin - Cookies, Privacy, Fair Use and Disclaimer - Advertise on MapCruzin.com

Copyright © 1996 - 2019 Michael Meuser, All Rights Reserved
MapCruzin is a Pop-Up Free Website -- Best Viewed With ANY Browser