HeatMap API for Google Maps and GIS
Sponsors
<-- Google Maps Free Resources
<-- Google Earth & Maps Resources
<-- Free GIS Shapefile Downloads
<-- Free World Shapefile Downloads
<-- Free GIS Software & Tools
<-- Free Global, Regional, State, City Maps
Create your own heat maps using HeatMapAPI. Use it over the Internet or as a .NET DLL to run in your environment. Integrate heat map images into Google Maps or other GIS systems.
What is a Heat Map?
A heat map is a graphical representation of two dimensional data (X, Y and Value) on a two dimensional surface by using colors. On a map a heat map is a representation of density of latitude and longitude points on a map. HeatmapAPI lets you creates heat map images you can overlay on your maps in your software.
How do Heat Maps Help?
Heat maps allow users quickly visualize density. Most maps you see, show points or themed polygons, but being able to understand the density of those points makes it much easier to see, especially when using colors with a heat map.
Create Your Own Heat Maps
We give you an API that enables you to create your own heat maps on your maps, in your application. We offer a limited but free API you can use, or you can upgrade for unlimited data points or optionally run the API on your server.
Sample Uses
There are many ways in which you can use this API. Here's one risk management example showing heightened risk factors in a city.
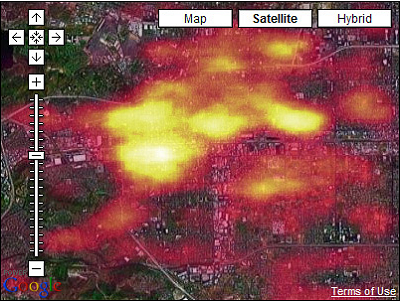
The API can also be used with demographic or most any other data you can think of.
Visit the HeatMapAPI Website
<-- Google Maps Free Resources
<-- Google Earth & Maps Resources
<-- Free GIS Shapefile Downloads
<-- Free World Shapefile Downloads
<-- Free GIS Software & Tools
<-- Free Global, Regional, State, City Maps
Didn't find what you are looking for? We've been online since 1996 and have created 1000's of pages. Search below and you may find just what you are looking for.
Michael R. Meuser
Data Research & GIS Specialist
MapCruzin.com is an independent firm
specializing in GIS project development and data research.
We created the first U.S. based
interactive toxic chemical facility
maps on the internet in 1996 and we
have been online ever since. Learn more about us and our services.
Have a project in mind? If you have data, GIS project or custom shapefile needs contact Mike.
Contact Us
Report Broken Links
Subscribe for Updates
Sponsors
Sponsors