NOAA Gnome Oil Spill Trajectory Model
Sponsors
<-- Free GIS Software & Resources
<-- Deepwater Horizon Gulf Oil Spill
See Also:
Free ArcGIS Shapefiles, Free Maps, Google Earth & Maps, Free GPS, Satellite and Aerial, GIS Tutorials.
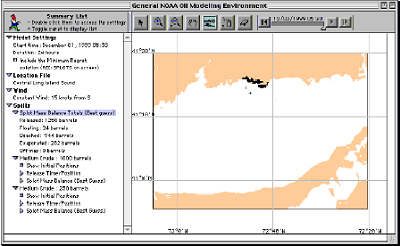
GNOME (General NOAA Operational Modeling Environment) is the oil spill trajectory model used by OR&R Emergency Response Division (ERD) responders during an oil spill.
ERD trajectory modelers use GNOME in Diagnostic Mode to set up custom scenarios quickly. In Standard Mode, anyone can use GNOME (with a Location File) to:
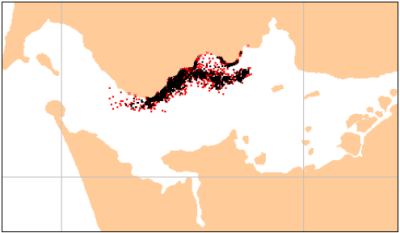
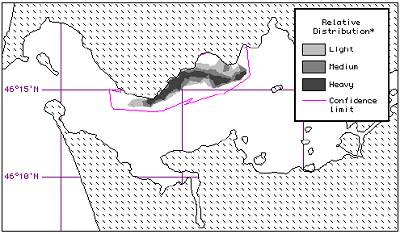
- predict how wind, currents, and other processes might move and spread oil spilled on the water.
- learn how predicted oil trajectories are affected by inexactness ("uncertainty") in current and wind observations and forecasts.
- see how spilled oil is predicted to change chemically and physically ("weather") during the time that it remains on the water surface.
Sponsors
To use GNOME, you describe a spill scenario by entering information into the program; GNOME then creates and displays an oil spill "movie" showing the predicted trajectory of the oil spilled in your scenario. Along with GNOME, most users also will want to download the Location Files for their regions of interest. Location Files contain prepackaged tide and current data and make it easier to work with GNOME.
GNOME was developed by the Emergency Response Division (ERD) of NOAA's Office of Response and Restoration (OR&R). The latest version is GNOME 1.3.1.
Visit the NOAA Office of Response and Restoration Website to Learn More and Download Gnome.
Sponsors
<-- Free GIS Software & Resources
<-- Deepwater Horizon Gulf Oil Spill
See Also:
Free ArcGIS Shapefiles, Free Maps, Google Earth & Maps, Free GPS, Satellite and Aerial, GIS Tutorials.
Didn't find what you are looking for? We've been online since 1996 and have created 1000's of pages. Search below and you may find just what you are looking for.
Michael R. Meuser
Data Research & GIS Specialist
MapCruzin.com is an independent firm
specializing in GIS project development and data research.
We created the first U.S. based
interactive toxic chemical facility
maps on the internet in 1996 and we
have been online ever since. Learn more about us and our services.
Have a project in mind? If you have data, GIS project or custom shapefile needs contact Mike.
Contact Us
Report Broken Links
Subscribe for Updates
|